65-0315—02
38
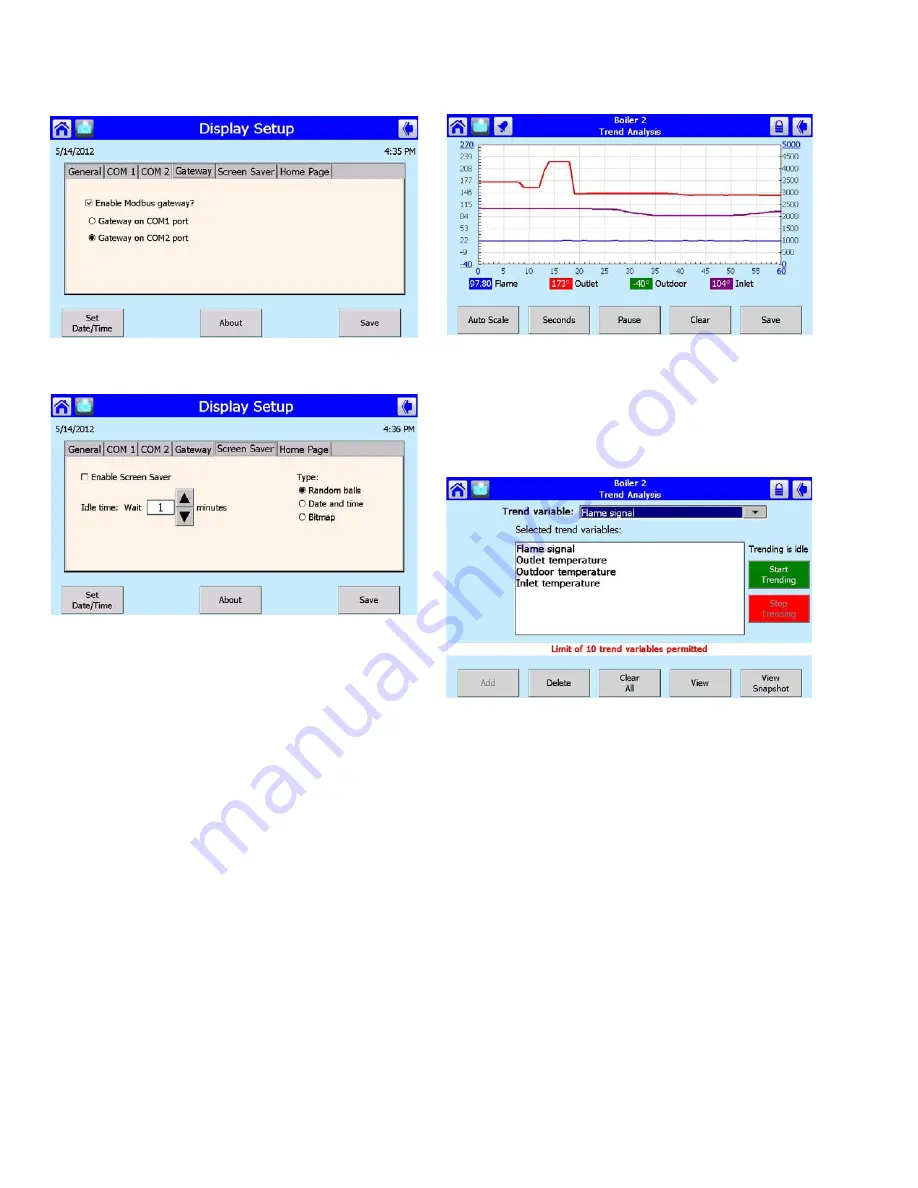
Fig. 85. Setup page - Gateway setup.
Fig. 86. Setup page - Screen setup.
Trend Analysis Page
Trend analysis of R7910 or R7911 status data can be viewed
on the S7999D. A graph displays a historical view of R7910 or
R7911 status data over varying time periods (see Fig. 87).
Pressing the device icon, then the “Details” button, will bring up
the “Status Details” screen (see Fig. 61). Press the “Analysis”
button to access trend variables (see Fig. 88 and Fig. 89).
A 2-dimensional graph with status data values shown on the Y
axis over time specified on the X axis is displayed. Status for
the most recent time is represented on the left side of the
graph with older status running towards the right side of the
graph.
Fig. 87. Trend analysis page.
Up to ten (10) R7910 or R7911 status variables can be viewed
at the same time on one trend analysis graph. Select the
status variables for the graph on the menu page (see Fig. 88).
This menu displays when the Trend Analysis button is
selected on the R7910 or R7911 status page.
Fig. 88. Trend analysis menu page.
The status variable with the largest range (minimum to
maximum) is used as the Y-axis range in the graph.
As the status variables are selected they are listed in a trend
variables list box. The user chooses the status variables from
a drop down menu and then presses the Add button to add
each status variable to the trend variable list.
Each status variable displayed in the trend analysis is
represented by a different colored line, as follows:
1.
First status variable = green
2.
Second status variable = yellow
3.
Third status variable = red
4.
Fourth status variable = blue
No more than two different measurement units (such as
degrees), are allowed for the status variables selected in the
trend analysis graph. Attempts to add a status variable with a
third measurement unit are rejected.
A second Y axis is displayed on the right side of the graph to
represent the scale for the second measurement unit.


