DIGIOP® 3D Camera User Manual
81
7.
Continue to “
Analyzing Queue and Service Zone Functionality
” to check your zone configuration.
6.3 Verifying queue placement and camera calibration
You can view various traffic maps from the queueing page that allow you to fine tune the placement of queue zones based on the
actual flow of traffic. To use this feature, DIGIOP® recommends that you clear all existing traffic maps and let the D3D-2500 camera
run for 4 to 6 hours to allow adequate traffic to flow through the tracking area. After 4-6 hours of run time, you can use the maps to
adjust your queue zones.
NOTE
All map data is cleared when the D3D-2500 is rebooted or when the Clear Maps button is pressed. After clearing map data, allow
the sensor to run for 4-6 hours before adjusting counting and filter zones. Viewing map data accumulated over several days may
be difficult to read due to the high number of tracks.
6.3.1 Types of Maps
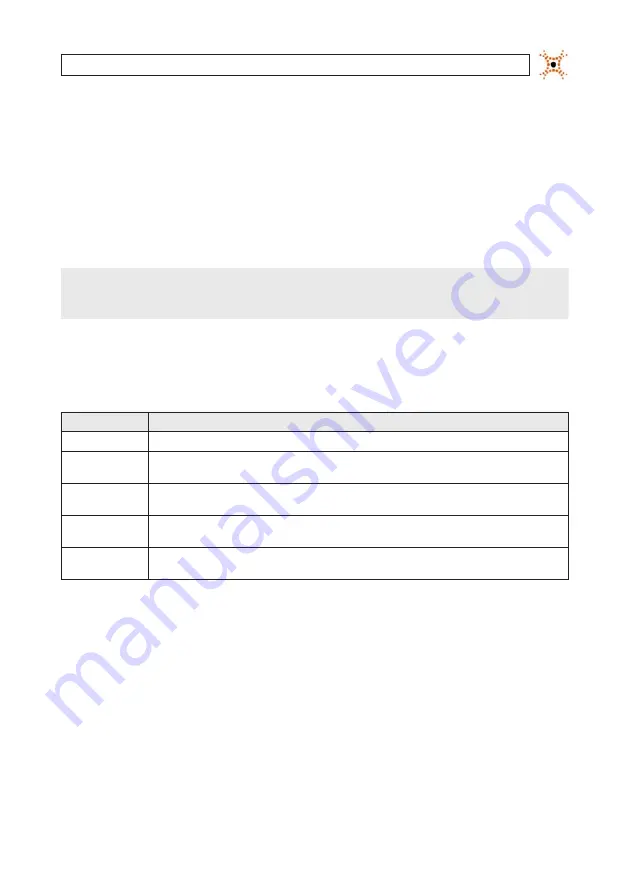
The types of maps available from the system are listed in the table below.
Map Name
Description
3-D Tracking
Shows the real time view of objects that are currently being tracked.
Traffic Map
Shows a color coded heat map of all tracks since the last reset. The brighter the colors, the higher the traffic volume. This map is
useful for positioning queue zones so that all queue traffic is counted.
Start Stop Map
Shows the start (green) and end (red) points of all tracks since the last reboot or when the Clear Maps button was pressed. This map
is useful for positioning the queue tail and the queue head.
Height Map
Shows a color coded heat map of all track heights since the last reset. The brighter the color, the taller the object. This map is useful
for verifying correct calibration settings.
Dwell Map
Shows a color coded heat map that displays the dwell points of all tracks since the last reset. This map is useful for positioning the
queue head zone and the queue exit. It is also used for positioning detection zones.
6.3.2 Verifying queue zone placement using Traffic and Dwell maps
To verify the queue zone placement:
1.
Access the Queueing tab and click Clear Maps.
2.
Allow the D3D-2500 to run for 4-6 hours to accumulate track data.
3.
Access the Counting tab and select Traffic Map from the drop-down box. The Traffic Map appears in the right image space.
The colored areas show the traffic flow through the field of view. The brighter the color, the higher the traffic volume. Dark
blue represents the lowest traffic volume, black represents zero traffic volume.
SECTION 6: CONFIGURING QUEUING APPLICATIONS
Содержание D3D-2500
Страница 8: ...viii www digiop com...
Страница 116: ...108 www digiop com SECTION 11 USING THE DIGIOP 3D CAMERA WITH DIGIOP ELEMENTS...
Страница 124: ...116 www digiop com...


