Monitoring System Health
8
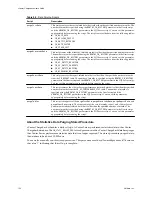
The System Health tab acts as a dashboard, providing you with information about and status of the entire
system. Only a user with Super User role has access to this tab.
The dashboard shows colored status indicators next to the URL for each server and service. The significance
of the colors is as is described in the table
Table 8-1
.
Table 8-1.
Significance of Dashboard Status Indicator Colors
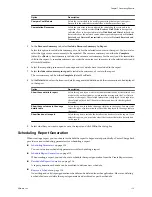
Color
Significance
Green
Normal
The response time within the acceptable range.
Yellow
Warning
The response time is beyond the acceptable range but not too high to be a cause of serious concern.
Red
Alert
The response time is too high. You must take immediate action. A very high response time might cause
the application to respond slowly or become unresponsive.
The response time ranges can be defined in the system. You can change these settings from the Settings tab.
To know more about response time settings, refer to
“Manage System Health Thresholds,”
on page 58.
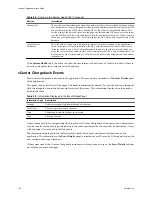
The information on the page is classified into six sections. The different sections and the corresponding
information displayed is listed in the table
Table 8-2
.
Table 8-2.
Section in the System Health Tab
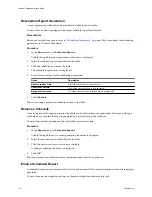
Section
Information
vCenter Chargeback
Servers
URL of all the vCenter Chargeback instances included in the cluster is listed. If the installation
is a stand-alone instance, only one URL is displayed. When you move the cursor over a URL, a
tool tip displays the URL to access the vCenter Chargeback instance, status of the instance,
response time, and product build number.
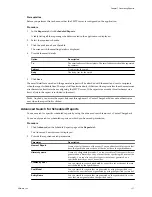
LDAP Servers
URL of all the LDAP servers configured in vCenter Chargeback is listed. When you move the
cursor over an LDAP server URL, a tool tip displays the URL and status of the LDAP server.
vCenter Servers
Display names of all the vCenter Server instances added to the vCenter Chargeback instances
in the cluster is listed. In the case of a stand-alone vCenter Chargeback instance, the display
names of all the vCenter Server instances added to the application is listed. When you move the
cursor over a vCenter Server name, a tool tip displays the name, status, response time, the
vCenter Server version, and the URL of the corresponding vCenter Server database.
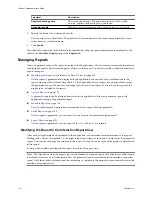
Data Collectors
Names of all the data collector instances along with name of the machine on which they are
installed is listed. When you move the cursor over the data collector name, a tool tip displays
the name of the data collector, the name of the host on which it is installed, and the status of the
data collector.
VMware, Inc.
127

