Cachegrind: a cache and branch-prediction profiler
can be changed with the
--cachegrind-out-file
option.
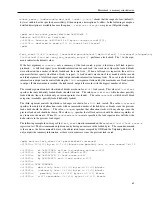
This file is human-readable, but is intended to be
interpreted by the accompanying program cg_annotate, described in the next section.
The default
.<pid>
suffix on the output file name serves two purposes. Firstly, it means you don’t have to rename
old log files that you don’t want to overwrite. Secondly, and more importantly, it allows correct profiling with the
--trace-children=yes
option of programs that spawn child processes.
The output file can be big, many megabytes for large applications built with full debugging information.
5.2.3. Running cg_annotate
Before using cg_annotate, it is worth widening your window to be at least 120-characters wide if possible, as the
output lines can be quite long.
To get a function-by-function summary, run:
cg_annotate <filename>
on a Cachegrind output file.
5.2.4. The Output Preamble
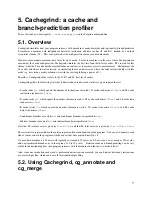
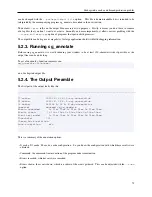
The first part of the output looks like this:
--------------------------------------------------------------------------------
I1 cache:
65536 B, 64 B, 2-way associative
D1 cache:
65536 B, 64 B, 2-way associative
LL cache:
262144 B, 64 B, 8-way associative
Command:
concord vg_to_ucode.c
Events recorded:
Ir I1mr ILmr Dr D1mr DLmr Dw D1mw DLmw
Events shown:
Ir I1mr ILmr Dr D1mr DLmr Dw D1mw DLmw
Event sort order:
Ir I1mr ILmr Dr D1mr DLmr Dw D1mw DLmw
Threshold:
99%
Chosen for annotation:
Auto-annotation:
off
This is a summary of the annotation options:
• I1 cache, D1 cache, LL cache: cache configuration. So you know the configuration with which these results were
obtained.
• Command: the command line invocation of the program under examination.
• Events recorded: which events were recorded.
• Events shown: the events shown, which is a subset of the events gathered. This can be adjusted with the
--show
option.
79

