Cachegrind: a cache and branch-prediction profiler
• Event sort order: the sort order in which functions are shown.
For example, in this case the functions are sorted
from highest
Ir
counts to lowest.
If two functions have identical
Ir
counts, they will then be sorted by
I1mr
counts, and so on. This order can be adjusted with the
--sort
option.
Note that this dictates the order the functions appear. It is
not
the order in which the columns appear; that is dictated
by the "events shown" line (and can be changed with the
--show
option).
• Threshold: cg_annotate by default omits functions that cause very low counts to avoid drowning you in information.
In this case, cg_annotate shows summaries the functions that account for 99% of the
Ir
counts;
Ir
is chosen as the
threshold event since it is the primary sort event. The threshold can be adjusted with the
--threshold
option.
• Chosen for annotation: names of files specified manually for annotation; in this case none.
• Auto-annotation: whether auto-annotation was requested via the
--auto=yes
option. In this case no.
5.2.5. The Global and Function-level Counts
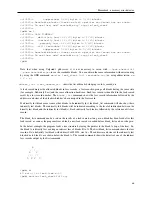
Then follows summary statistics for the whole program:
--------------------------------------------------------------------------------
Ir
I1mr ILmr Dr
D1mr
DLmr
Dw
D1mw
DLmw
--------------------------------------------------------------------------------
27,742,716
276
275 10,955,517 21,905 3,987 4,474,773 19,280 19,098
PROGRAM TOTALS
These are similar to the summary provided when Cachegrind finishes running.
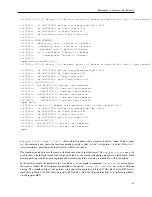
Then comes function-by-function statistics:
80

