Memcheck: a memory error detector
•
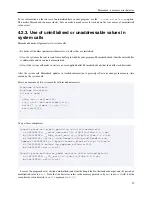
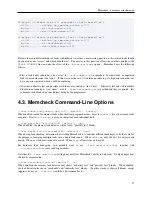
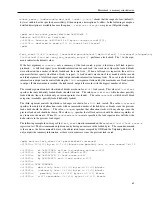
check_memory [addressable|defined] <addr> [<len>]
checks that the range of <len> (default 1)
bytes at <addr> has the specified accessibility. It then outputs a description of <addr>. In the following example, a
detailed description is available because the option
--read-var-info=yes
was given at Valgrind startup:
(gdb) monitor check_memory defined 0x8049e28
1
Address 0x8049E28 len 1 defined
==14698==
Location 0x8049e28 is 0 bytes inside string10[0],
==14698==
declared at prog.c:10, in frame #0 of thread 1
(gdb)
•
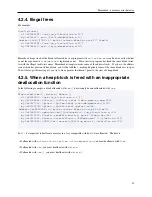
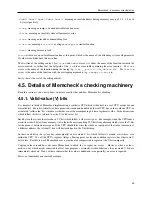
leak_check [full*|summary] [reachable|possibleleak*|definiteleak] [increased*|changed|any]
[unlimited*|limited <max_loss_records_output>]
performs a leak check. The
*
in the argu-
ments indicates the default values.
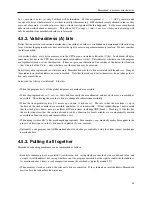
If the first argument is
summary
, only a summary of the leak search is given; otherwise a full leak report is
produced.
A full leak report gives detailed information for each leak: the stack trace where the leaked blocks
were allocated, the number of blocks leaked and their total size.
When a full report is requested, the next two
arguments further specify what kind of leaks to report. A leak’s details are shown if they match both the second
and third argument. A full leak report might output detailed information for many leaks. The nr of leaks for which
information is output can be controlled using the
limited
argument followed by the maximum nr of leak records
to output. If this maximum is reached, the leak search outputs the records with the biggest number of bytes.
The second argument controls what kind of blocks are shown for a
full
leak search. The value
definiteleak
specifies that only definitely leaked blocks should be shown. The value
possibleleak
will also show possibly
leaked blocks (those for which only an interior pointer was found).
The value
reachable
will show all block
categories (reachable, possibly leaked, definitely leaked).
The third argument controls what kinds of changes are shown for a
full
leak search. The value
increased
specifies that only block allocation stacks with an increased number of leaked bytes or blocks since the previous
leak check should be shown.
The value
changed
specifies that allocation stacks with any change since the
previous leak check should be shown. The value
any
specifies that all leak entries should be shown, regardless of
any increase or decrease. When If
increased
or
changed
are specified, the leak report entries will show the
delta relative to the previous leak report.
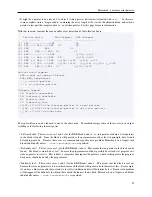
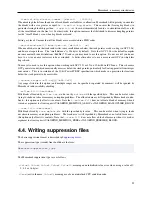
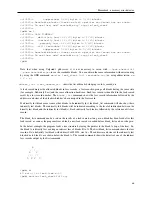
The following example shows usage of the
leak_check
monitor command on the
memcheck/tests/leak-cases.c
regression test. The first command outputs one entry having an increase in the leaked bytes. The second command
is the same as the first command, but uses the abbreviated forms accepted by GDB and the Valgrind gdbserver. It
only outputs the summary information, as there was no increase since the previous leak search.
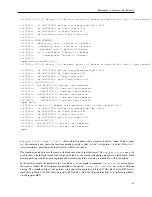
(gdb) monitor leak_check full possibleleak increased
==19520== 16 (+16) bytes in 1 (+1) blocks are possibly lost in loss record 9 of 12
==19520==
at 0x40070B4: malloc (vg_replace_malloc.c:263)
==19520==
by 0x80484D5: mk (leak-cases.c:52)
==19520==
by 0x804855F: f (leak-cases.c:81)
==19520==
by 0x80488E0: main (leak-cases.c:107)
==19520==
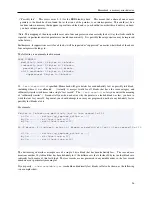
==19520== LEAK SUMMARY:
==19520==
definitely lost: 32 (+0) bytes in 2 (+0) blocks
==19520==
indirectly lost: 16 (+0) bytes in 1 (+0) blocks
==19520==
possibly lost: 32 (+16) bytes in 2 (+1) blocks
==19520==
still reachable: 96 (+16) bytes in 6 (+1) blocks
65


