Cachegrind: a cache and branch-prediction profiler
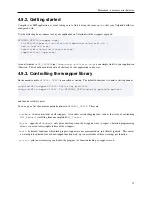
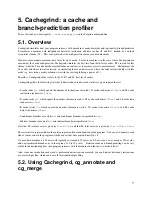
First off, as for normal Valgrind use, you probably want to compile with debugging info (the
-g
option).
But
by contrast with normal Valgrind use, you probably do want to turn optimisation on, since you should profile your
program as it will be normally run.
Then, you need to run Cachegrind itself to gather the profiling information, and then run cg_annotate to get a detailed
presentation of that information. As an optional intermediate step, you can use cg_merge to sum together the outputs
of multiple Cachegrind runs into a single file which you then use as the input for cg_annotate.
Alternatively, you
can use cg_diff to difference the outputs of two Cachegrind runs into a signel file which you then use as the input for
cg_annotate.
5.2.1. Running Cachegrind
To run Cachegrind on a program
prog
, run:
valgrind --tool=cachegrind prog
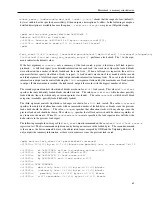
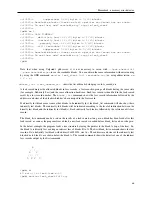
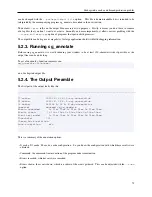
The program will execute (slowly). Upon completion, summary statistics that look like this will be printed:
==31751== I
refs:
27,742,716
==31751== I1
misses:
276
==31751== LLi misses:
275
==31751== I1
miss rate:
0.0%
==31751== LLi miss rate:
0.0%
==31751==
==31751== D
refs:
15,430,290
(10,955,517 rd + 4,474,773 wr)
==31751== D1
misses:
41,185
(
21,905 rd +
19,280 wr)
==31751== LLd misses:
23,085
(
3,987 rd +
19,098 wr)
==31751== D1
miss rate:
0.2% (
0.1%
+
0.4%)
==31751== LLd miss rate:
0.1% (
0.0%
+
0.4%)
==31751==
==31751== LL misses:
23,360
(
4,262 rd +
19,098 wr)
==31751== LL miss rate:
0.0% (
0.0%
+
0.4%)
Cache accesses for instruction fetches are summarised first, giving the number of fetches made (this is the number of
instructions executed, which can be useful to know in its own right), the number of I1 misses, and the number of LL
instruction (
LLi
) misses.
Cache accesses for data follow. The information is similar to that of the instruction fetches, except that the values are
also shown split between reads and writes (note each row’s
rd
and
wr
values add up to the row’s total).
Combined instruction and data figures for the LL cache follow that. Note that the LL miss rate is computed relative
to the total number of memory accesses, not the number of L1 misses.
I.e.
it is
(ILmr + DLmr + DLmw) /
(Ir + Dr + Dw)
not
(ILmr + DLmr + DLmw) / (I1mr + D1mr + D1mw)
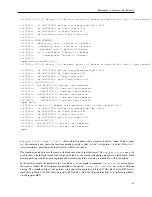
Branch prediction statistics are not collected by default. To do so, add the option
--branch-sim=yes
.
5.2.2. Output File
As well as printing summary information, Cachegrind also writes more detailed profiling information to a file.
By
default this file is named
cachegrind.out.<pid>
(where
<pid>
is the program’s process ID), but its name
78


