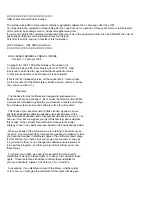
Massif: a heap profiler
--------------------------------------------------------------------------------
n
time(B)
total(B)
useful-heap(B) extra-heap(B)
stacks(B)
--------------------------------------------------------------------------------
0
0
0
0
0
0
1
1,008
1,008
1,000
8
0
2
2,016
2,016
2,000
16
0
3
3,024
3,024
3,000
24
0
4
4,032
4,032
4,000
32
0
5
5,040
5,040
5,000
40
0
6
6,048
6,048
6,000
48
0
7
7,056
7,056
7,000
56
0
8
8,064
8,064
8,000
64
0
Each normal snapshot records several things.
• Its number.
• The time it was taken. In this case, the time unit is bytes, due to the use of
--time-unit=B
.
• The total memory consumption at that point.
• The number of useful heap bytes allocated at that point. This reflects the number of bytes asked for by the program.
• The number of extra heap bytes allocated at that point. This reflects the number of bytes allocated in excess of what
the program asked for. There are two sources of extra heap bytes.
First, every heap block has administrative bytes associated with it. The exact number of administrative bytes depends
on the details of the allocator. By default Massif assumes 8 bytes per block, as can be seen from the example, but
this number can be changed via the
--heap-admin
option.
Second, allocators often round up the number of bytes asked for to a larger number, usually 8 or 16. This is required
to ensure that elements within the block are suitably aligned. If N bytes are asked for, Massif rounds N up to the
nearest multiple of the value specified by the
--alignment
option.
• The size of the stack(s).
By default, stack profiling is off as it slows Massif down greatly.
Therefore, the stack
column is zero in the example. Stack profiling can be turned on with the
--stacks=yes
option.
142


