


APPENDIX F: BASICS OF RESISTANCE WELDING
HF25D LINEAR DC RESISTANCE WELDING CONTROL
F-6
990-333
2
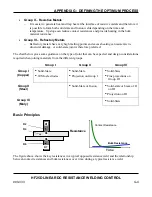
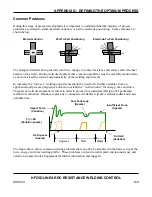
Continue increasing weld current, voltage, or power until any unfavorable characteristic occurs,
such as sticking or spitting.
3
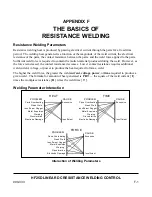
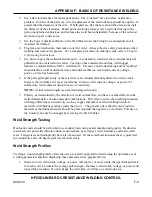
Repeat steps 1 through 3 for different weld forces, then create a plot of part pull strength versus
weld current, voltage, or power for different weld forces as shown in the illustration on the next
page,
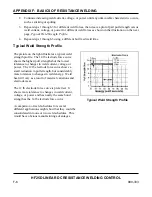
Typical Weld Strength Profile
.
4
Repeat steps 1 through 3 using a different but fixed weld time.
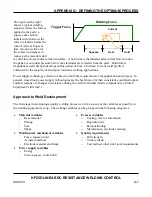
Typical Weld Strength Profile
The picture on the right illustrates a typical weld
strength profile. The 14 lb electrode force curve
shows the highest pull strengths but the lowest
tolerance to changes in weld current, voltage, or
power. The 12 lb electrode force curve shows a
small reduction in pull strength, but considerably
more tolerance to changes in weld energy. Weld
heat will vary as a result of material variations and
electrode wear.
The 12 lb electrode force curve is preferred. It
shows more tolerance to changes in weld current,
voltage, or power and has nearly the same bond
strength as the 14 lb electrode force curve.
A comparison of weld schedules for several
different applications might show that they could be
consolidated into one or two weld schedules. This
would have obvious manufacturing advantages.
Typical Weld Strength Profile
Summary of Contents for HF25A
Page 9: ...HF25D DC RESISTANCE WELDING SYSTEM 990 333 ix ...
Page 10: ......
Page 20: ......
Page 84: ...CHAPTER 6 CALIBRATION HF25D DC RESISTANCE WELDING SYSTEM 990 333 6 4 Final Calibration Setup ...
Page 113: ......
Page 129: ......
Page 153: ......
Page 171: ......


