


19
QuickStart
Power Quality Recorder SICAM Q80 7KG8080, System manual
E50417-H1076-C420-A2, Release 12.01.2015
4.5
Evaluation
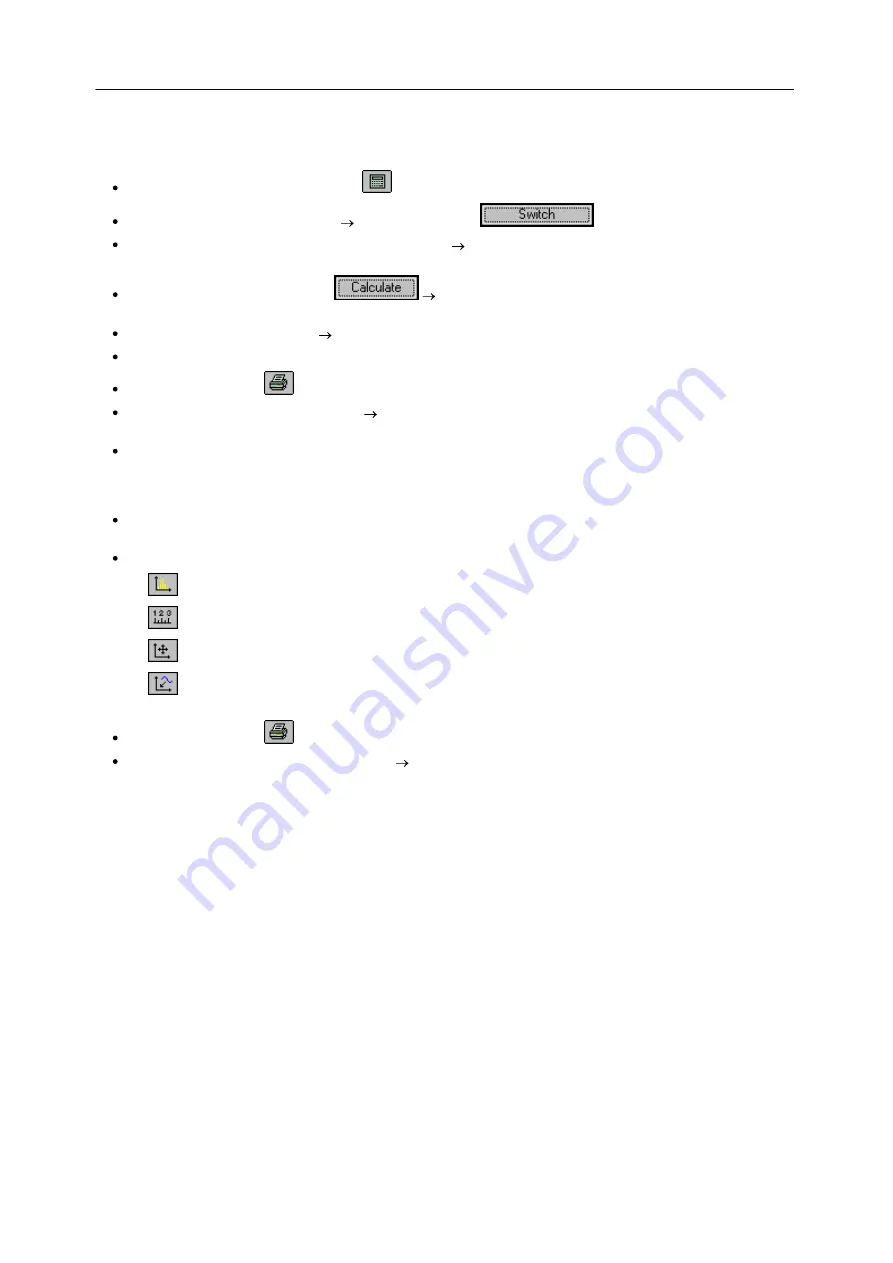
Go to analysis mode via toolbar button
or
Task process / Evaluation
Select a measurement from the list
double-click or click
Task process / Evaluation / Network quality report
opens the report dialog, with display measurement
settings and measurement duration
At the start of the evaluation, click
Evaluation as per EN 50160 NV and MV or select other
value limits in
Task process / Evaluation / Standard and limit values
Summary form appears filled in
are there values which exceed standards limits?
Clicking on a bar in the overview chart, you go to the corresponding results table.
Use the toolbar button
or
menu item "
Parameter-Set / Print.
." to print out the report
Detailed observation of measured data
under
Task process / Evaluation
, special overviews are available for
each type of measured data
E.g.
Task process / Evaluation / Frequency
displays
o
table of all immediately displayable data,
o
table of minimum and maximum values of the displayable data.
At the right edge of the window, there is a toolbar (the functions affect the data window selected, if more than
one window is open. A mouse-click on a window highlights it).
The available buttons are:
o
Calculates histograms for the selected data
o
Opens the dialog for Measuring/displaying data values
o
Opens a data navigator (for moving through a long measurement data set)
o
Opens the dialog
Channel selection…
, in order to be able to add any amount of additional channels to
the data window
Use the toolbar button
or the menu item "
Parameter-Set / Print
.." to print out the data window
Menu item "
Parameter-Set / Print preview
"
see effect of printout settings; make changes before printout, for
example, add comments…