10 / 176
Siemens
Web server OZW772... V6.0
CE1C5701en
Building Technologies
Overview
2015-10-12
1.3 User
interface
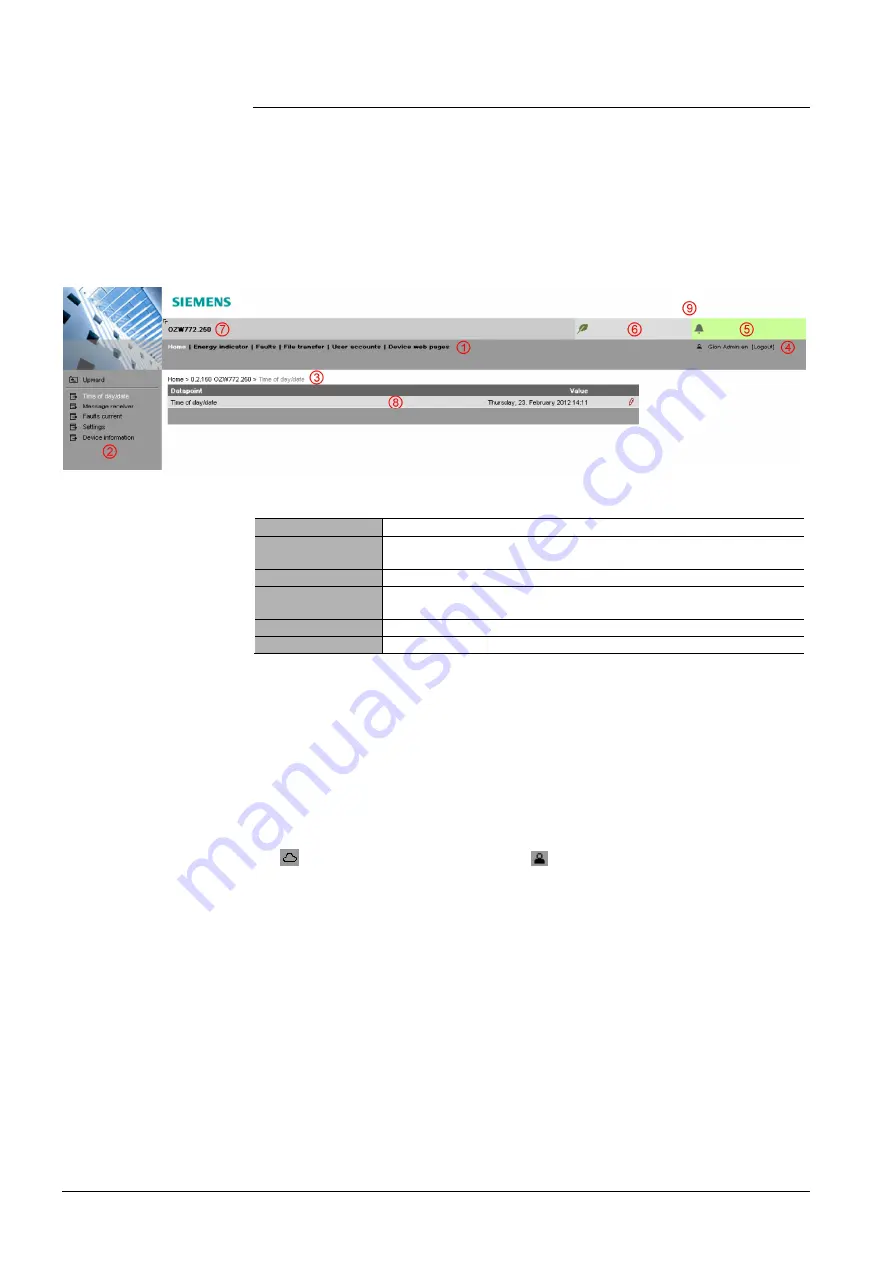
A web browser is used to access the user interface for the Web Server.
·
The Web Server provides text-based operation of the Web Server and
connected Synco devices as a standard (Section 4).
·
You can also set up visualized operation (Section 5).
The following describes the display areas for the text-based standard user interface
(display areas for visualization are outlined in Section 5).
The main window is sub-divided into various areas.
The following functions are selected via primary navigation:
Home
Menu-based plant and device operation.
Energy indicator
Display and operate "Energy indicator" data points.
(displayed only is controller is connected with an Energy indicator)
Faults
Display system faults.
File transfer
Download consumption data and event history,
upload documents, logos and system definitions.
User accounts
User administration.
Device web pages
Create device list and operating pages.
Device operation (via home) queries devices and their operating pages via
secondary navigation (menu tree). As of OZW-Version 5.0, KNX pages defined in
ETS are displayed here too.
The path displays the workflow starting at the main menu to the open operating
page. Simply click at any point on the path to return to that location.
This field shows the currently logged-in user. Clicking [Logout] ends the current
session. The session remains active until logout. When connecting via the portal
the
symbol is displayed instead of the
symbol and the user’s email address
is displayed rather than the user name.
The "Plant state fault" field is displayed permanently:
·
Green field:
No fault
·
Red field:
Plant fault
Click the "Plant state fault" field to display all faults in the plant.
The "Plant state Energy indicator" field is displayed permanently:
·
Green leaf:
All "Energy indicator" data points are always within
their "green limits", i.e. "within the green/allowed range".
·
Orange leaf:
One or multiple "Energy indicator" data points are
outside their "green limits"
Clicking the "Plant state Energy indicator" field opens the "Energy indicator"
function.
Primary navigation
Secondary navigation
Command sequence
User
Plant state
fault
Plant state
Energy indicator


