


Chapter 7
Monitoring
Meters
Viewing Real-time Harmonic Spectrum
EM13x Series SMART MULTIFUNCTION METER
127
Viewing Phase-to-phase Voltages
PAS can transform phase-to-neutral voltage waveforms in
configurations with a neutral into phase-to-phase waveforms allowing
you to view the waveshape, angle relationships and harmonics of the
phase-to-phase voltages.
Click on the
button on the waveform window toolbar. Click the
button once again to return to phase-to-neutral waveforms.
7.4
Viewing Real-time Harmonic Spectrum
To retrieve real-time harmonic spectrum from your meter:
Ensure that the
On-line
button
on the PAS toolbar is checked.
Select the device site from the list box on the toolbar.
Select
RT Harmonic Monitor
from the Monitor menu or click on the
button on the PAS toolbar.
Click on the “Poll” or “Continuous poll”
button to poll the meter
once or continuously. Click on the
Stop
button
to stop continuous
polling.
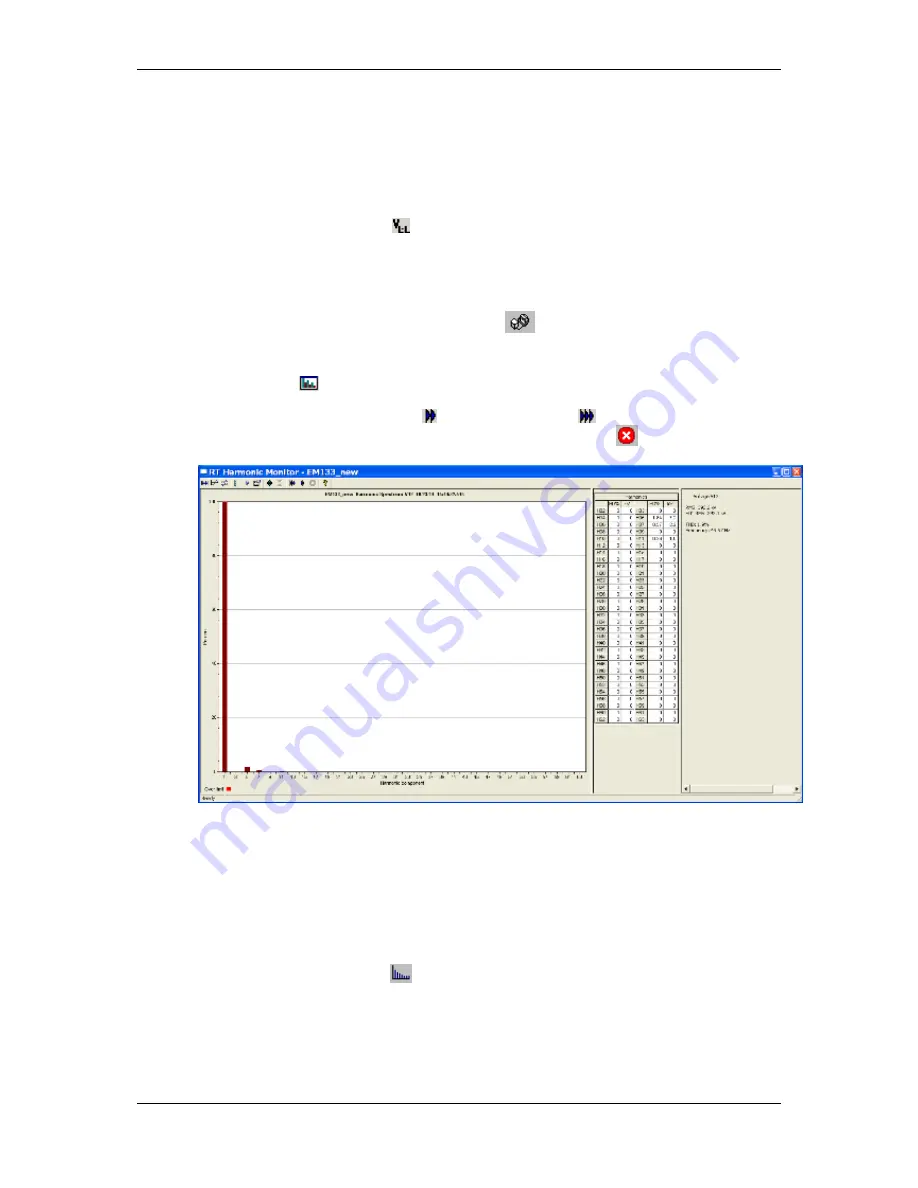
Figure
7-3: RT Harmonic Monitor – Spectrum Chart
PAS retrieves harmonic spectrum for V1-V3 and I1-I3 channels.
Harmonics can be displayed as a spectrum chart for a selected channel
or in a table. PAS can also synthesize waveforms based on the
harmonic spectrum to let you view a shape of the voltage and current
waveforms in your network.
Viewing a Spectrum Chart
Click on the
button to view a spectrum chart for the selected
channel. To change a channel, click on the window with the right
mouse button, select
Channels...,
check the channel you want
displayed, and then click
OK
. PAS provides voltage, current, active
power and reactive power spectrum charts.


