System Overview
R&S
®
ZVT
55
Getting Started 1300.0045.62 ─ 10
●
The value behind the color legend shows the
constant stimulus value
, which is
either the power of the internal signal source (for frequency sweeps and time
sweeps) or the CW frequency (for power sweeps). "fb" denotes the channel base
frequency; "Pb" the channel base power.
●
Stop
indicates the highest value of the sweep variable (e.g. the highest frequency
measured), corresponding to the right edge of the Cartesian diagram.
Right-click any of the sections in the trace list (except the color legend) to open a con-
text menu and access the most common tasks related to the section.
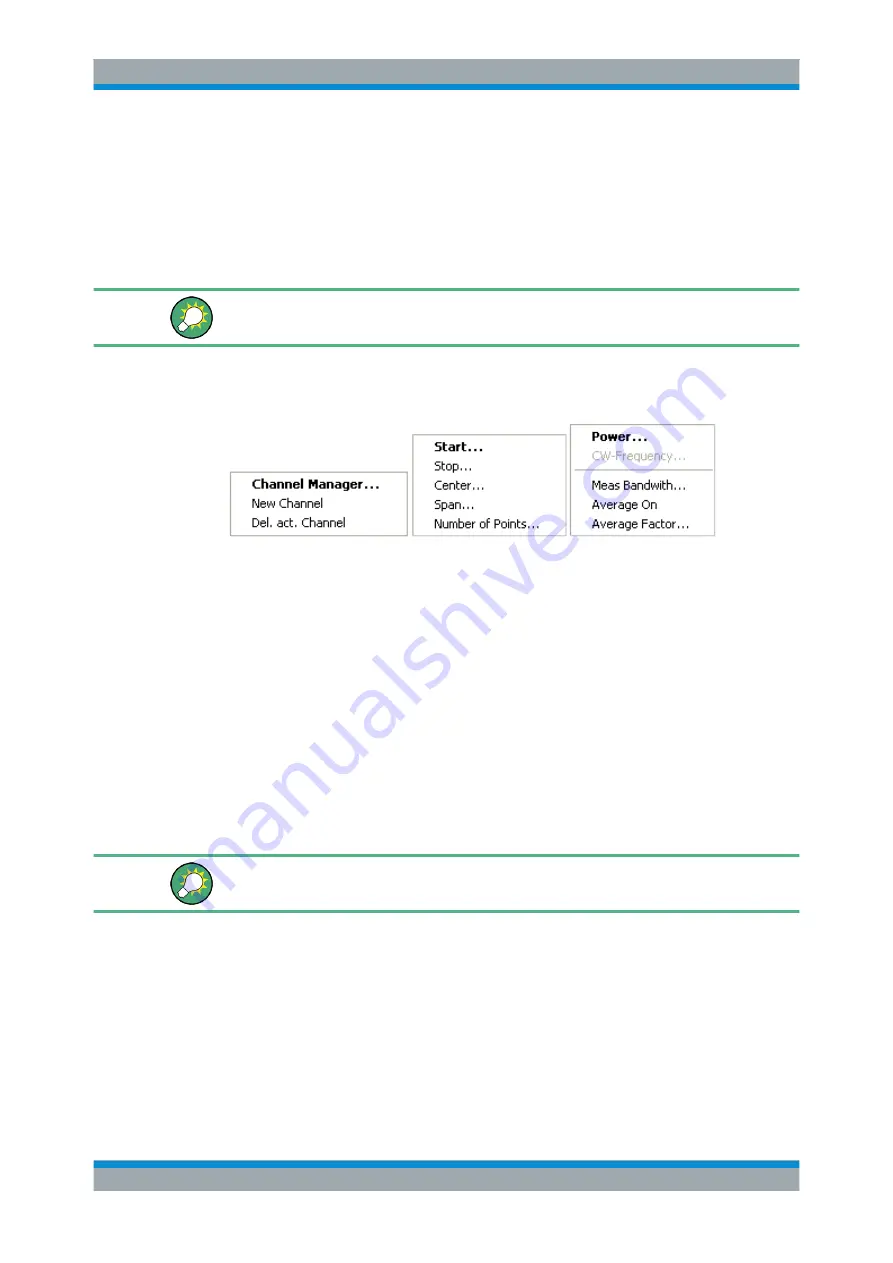
A right mouse click on the channel name, the sweep range, and the additional parame-
ter section of the channel list opens the following
context menus
, respectively:
The settings correspond to the most common commands in the "Channel – Channel
Select", "Channel – Stimulus" and "Channel – Power Bandwidth Average" menus.
3.2.2.5
Context Menus
To provide access to the most common tasks and speed up the operation, the analyzer
offers context menus (right-click menus) for the following display elements:
●
Diagram area
●
Marker info field
●
Trace list (separate context menus for trace name section, measured quantity sec-
tion, format section, scale section, and channel section)
●
Channel list (separate context menus for channel name section, sweep range sec-
tion, additional parameter section)
Working with context menus requires a mouse. Click inside the display element that
you want to work with using the right mouse button.
Except from some particular screen configurations, anything you can do from a context
menu you can also do from the menu bar or hardkey and softkey bar. Use whatever
method is most convenient for you.
3.2.3 Dialogs
Dialogs provide groups of related settings and allow to make selections and enter data
in an organized way. All softkeys with three dots behind their labeling (as in "Marker
Screen Elements


