Operating the R&S
QAR
R&S
®
QAR
48
User Manual 1178.7200.02 ─ 09
3
2
1
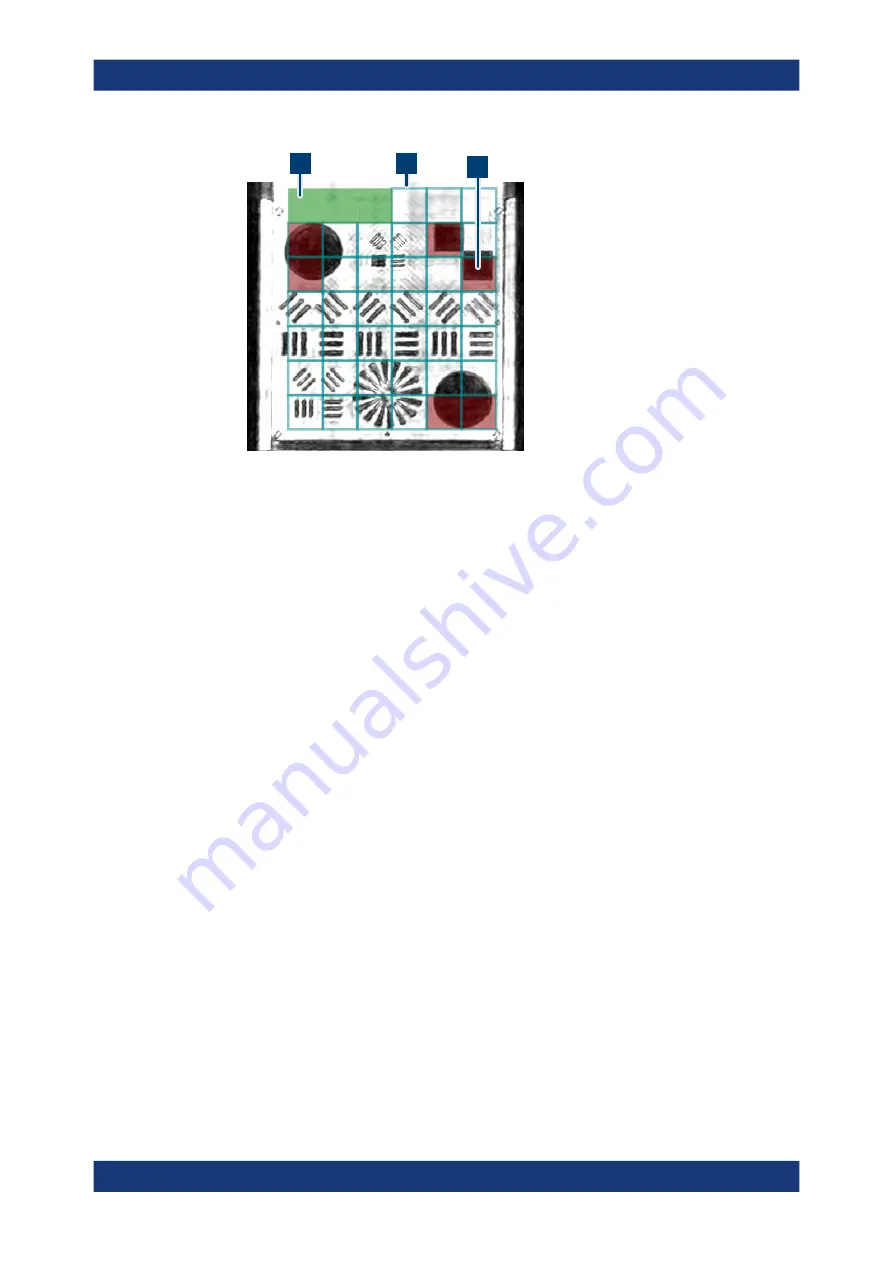
Figure 5-6: Grid evaluation example
1 = Green cells indicate master cells
2 = Blue grid indicates cells of "Grid 1" (not shown: a yellow grid indicates cells of "Grid 2")
3 = Red cells indicate a violation of the threshold somewhere in the area the cell covers
Managing measurement results
You can export the measurement data, for example to store it on an external memory
device or copy it to a different computer for further analysis with different software. You
can also restore data that you have taken at some point and review it in the applica-
tion.
1. Select "Options" > "Recording".
2. Define the default directory in which to save the results in the "Result Folder" input
field.
For each measurement, the R&S
QAR creates a folder that contains the measure-
ment data.
3. Select "Autosave" to use the auto save functionality.
When you are using the autosave feature, the R&S
QAR automatically stores the
results after each measurement.
Tip:
You can always save the measurement results deliberately with the keyboard
shortcut Ctrl-S or from the "File" menu.
4. Select the data you want to save from the "Results To Save" dropdown menu.
A measurement dataset contains the following files.
●
<yyyy-mm-dd-hh-mm-ss>_cfg.txt
<yyyy-mm-dd-hh-mm-ss>_PanelConf.mat
Contains information about the configuration of the R&S
QAR during the mea-
surement.
●
<yyyy-mm-dd-hh-mm-ss>_image.png
<yyyy-mm-dd-hh-mm-ss>_transmissionloss.png
Radome Measurements


