8.1 DownVision
™
application overview
The
DownVision
™
application uses a compatible
transducer to produce a detailed structure view of
the water column beneath your vessel This enables
you to accurately distinguish bottom structure, and
underwater objects.
DownVision
™
uses
CHIRP
processing with a centered 350 KHz ping frequency,
which provides a higher resolution image than the
Sonar application.
The
DownVision
™
application displays a scrolling
image which scrolls from right to left across the
screen.
The
DownVision
™
application uses monochrome
palettes and shading to differentiate between target
strengths.
D12780-1
7
1
3
6
2
4
5
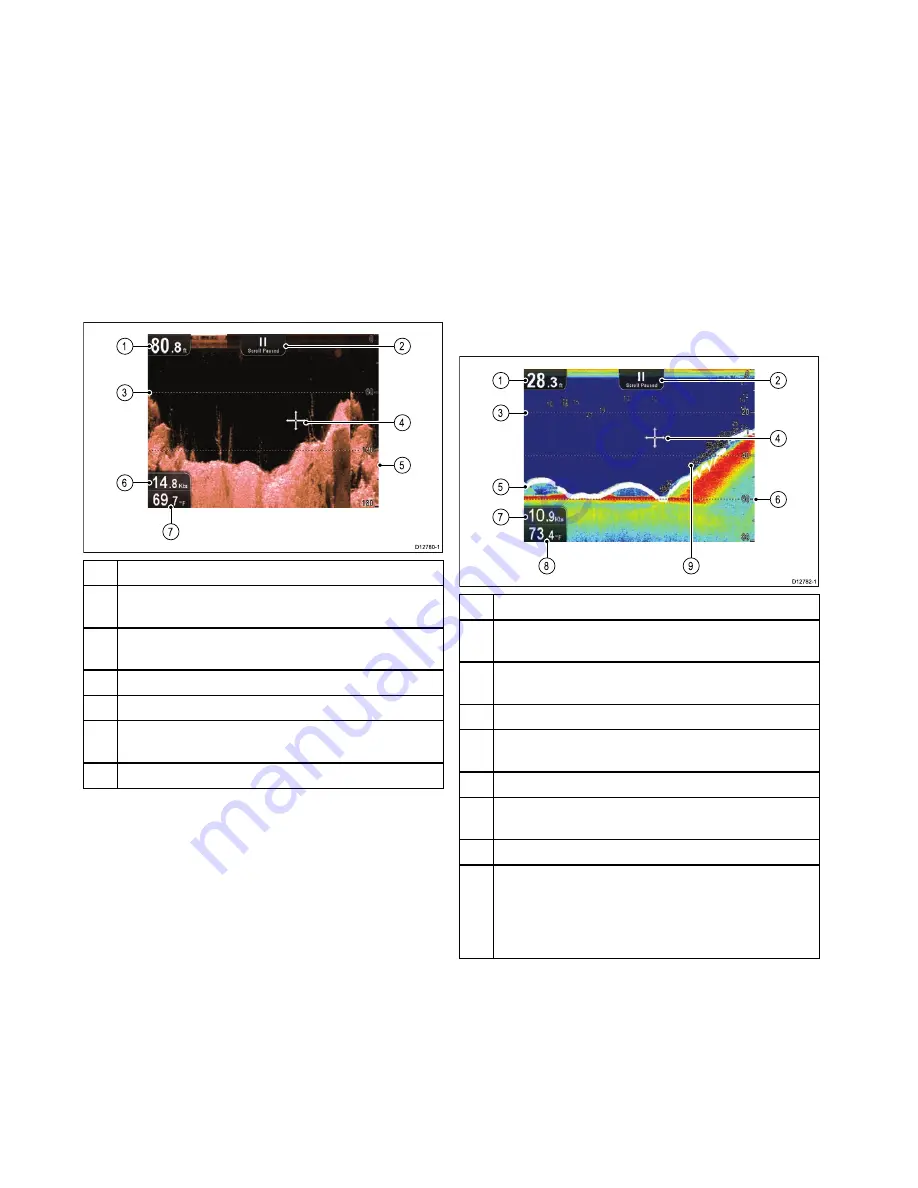
1
Depth reading
— Current depth of the bottom.
2
Scrolling paused
— Scrolling pauses when the
Joystick is used to move the cursor around the screen).
3
Depth lines
— Horizontal dashed lines drawn at regular
intervals to indicate the depth from the surface.
4
Cursor
— Displayed in cursor mode.
5
Depth markers
— These numbers indicate depth.
6
Speed
— Current vessel Speed Over Ground (SOG).
Only applicable to displays with GPS / GNSS receivers
7
Water temperature
— Current water temperature.
8.2 Sonar application overview
The Sonar application uses a compatible transducer
to produce a detailed view of fish and the water
column including bottom under your vessel. This
enables you to accurately distinguish between
different sizes of fish, bottom structure, and
underwater objects. The Sonar application uses
CHIRP
processing with a centered 200 KHz ping
frequency, which provides a greater depth range
than
DownVision™
but less detail.
The Sonar application displays a scrolling image
which scrolls from right to left across the screen.
The Sonar application uses different colors to
differentiate target strengths. The colors used are
dependent upon the selected color palette (e.g. the
classic blue color palette uses blue to identify the
weakest targets and red for the strongest).
D12782-1
8
9
1
3
5
7
2
4
6
1
Depth reading
— Current bottom depth.
2
Scrolling paused
— Scrolling pauses when the
Joystick is used to move the cursor around the screen).
3
Depth lines
— Horizontal dashed lines drawn at regular
intervals to indicate the depth from the surface.
4
Cursor
— Displayed in cursor mode.
5
Bottom line
— Displays a thick line to identify the
bottom.
6
Depth markers
— These numbers indicate depth.
7
Speed
— Current vessel Speed Over Ground (SOG).
Only applicable to displays with GPS / GNSS receivers
8
Water temperature
— Current water temperature.
9
Depth Target ID
— Depths are displayed against
recognized targets. The sensitivity of these IDs is
directly linked to the Fish Alarm sensitivity; the greater
the fish alarm sensitivity, the greater the number of
labelled returns.
The sonar image
Interpreting the bottom using sonar
It is important to understand how to correctly interpret
the bottom structure represented on-screen.
The bottom usually produces a strong echo.
The following images show how different bottom
conditions are represented on-screen:
60
Dragonfly–4 / Dragonfly–5 / Dragonfly–7 / Wi–Fish


