57
in one of the full color modes, the warning and the
reading will be shown in red.
To set up the limits screen do as follows:
1.
From the main power or energy screen press
“Menu”, select “Limits” and enter.
2.
Select “Low” and enter. Now enter the low limit
value by pressing the up/down navigation keys to
change each number and the right/left navigation
keys to move to the next number. After you are
finished, press “Save”.
3.
Do the same for the “High” limit.
4.
If you want the limits screen to be the startup default
of the Vega, follow the instructions in section 3.5.
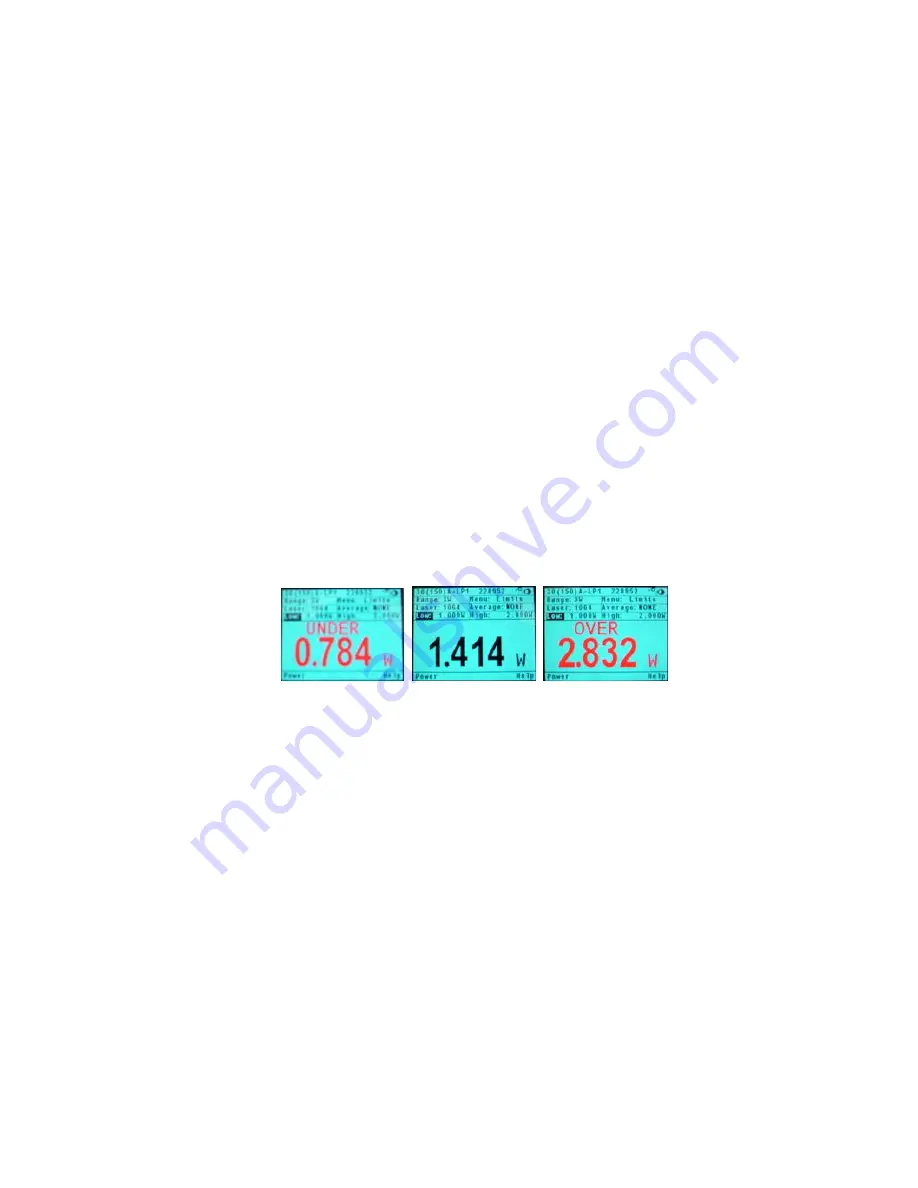
When the power or energy is over or under the limits
chosen, the error message will be shown as in Figure
4.9. Note that the lower limit is shown on the upper left
and the upper limit on the upper right.
Figure 4.9 Limits Screens with limits set to 1W and 2W
4.6.4. Power and Energy Needle Screens
The Vega provides a simulation of an analog needle.
Similar to the bargraph display, this allows the user to
graphically view the measurement as a percentage of
the full scale. It is possible to expand this needle to cover
the full screen of the Vega by pressing the “Expand”
button.
When in one of the full color modes, the expanded needle
will display the minimum and maximum readings. On the
needle graph, older readings will stay on the screen. This
allows a user to visually track the range of readings that
have been taken.


