Color measurements
50
NANOCOLOR
®
UV
/
VIS
II and
NANOCOLOR
®
VIS
II V 1.1 / 10.2017
5.6.7
Visual color scales
The color indexes Hazen / APHA / PtCo, the iodine color index, and the Ph. Eur. color index
are defined only visually. The spectrophotometer performs an approximation of the
measured CIE-L*a*b* values against a calibration table ("estimate").
5.6.7.1
Iodine color index
The iodine color index measures the color gamut from colorless to yellowish to dark brown
and is measured in 10 mm cuvettes. The values according to DIN 6162 range from 10 (light
yellow) to 100 (brown). Samples are compared to solutions containing 10 mg, 20 mg, 30 mg,
40 mg, etc. of iodine in a 100 ml solution of potassium iodide. Intermediate values are not
specified, but may be stipulated. The use of the iodine color index requires that the sample
has a "similar" color to the color of iodine. The iodine color index is expressed in mg iodine /
100 ml solution. The ZERO reference is distilled water.
5.6.7.2
Ph. Eur. color index
The European Pharmacopoeia defines three color standards for red (cobalt chloride / HCl),
blue (copper chloride / HCl) and yellow (iron (III) chloride / HCl). These are used to mix five
color schemes for the colors red, brown, brown-yellow, yellow and yellow-green. They are
then further diluted. It covers colors that are brighter. The color is specified as red, brown,
brown-yellow, yellow, yellow-green and the number specifies the solution according to Ph
Eur 2:02:02. The strongest color solution always has the number 1. B ranges from B1 to B9,
all other color solutions only to 7. A differentiation of the bright solutions B9, GY7 and G7 is
difficult even with a photometer. The Ph. Eur. Color index is measured in 50 mm cuvettes
based on DAB 4.00/2.02.02.00. The ZERO reference is distilled water.
5.6.8
Distinction of the color index according to Ph. Eur. Sec. 2.2.2
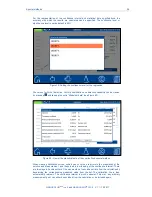
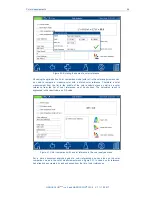
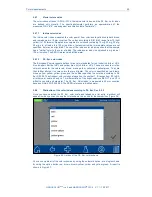
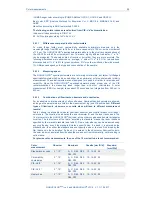
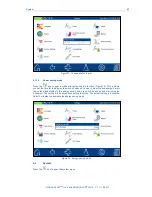
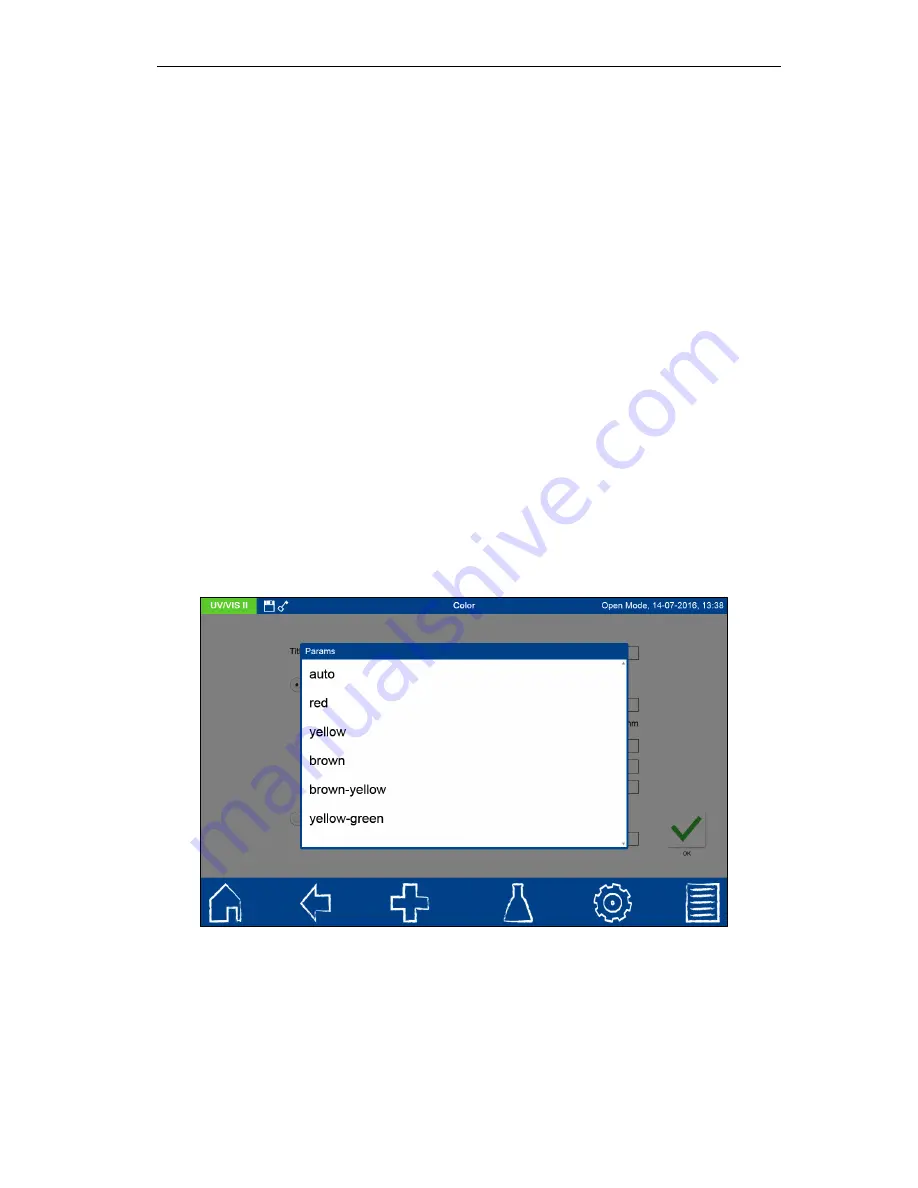
Once you have selected the Ph. Eur. color scale and tapped on a list entry, a window will
appear in which you can choose the color scheme to be used for the comparison (Figure 56).
Figure 56: List box of the Ph. Eur. color scheme
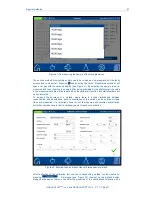
You can compare all of the color schemes by using the
automatic
option, or a single scheme
by using the option button
red
,
brown
,
brown-yellow
,
yellow
and
yellow-green
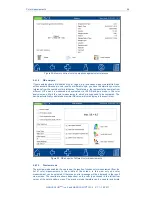
. A result is
shown in Figure 57.
Summary of Contents for NANOCOLOR UV/VIS II
Page 1: ......

