


Special methods
34
NANOCOLOR
®
UV
/
VIS
II and
NANOCOLOR
®
VIS
II V 1.1 / 10.2017
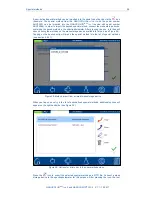
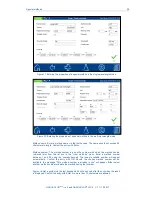
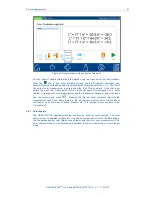
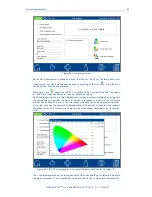
Please note:
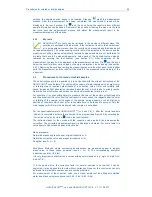
When the “reagent blank value” option is used, the photometer assumes that
the corresponding regression line passes through the zero point. If the regression line is
supposed to pass through the zero point even when measured against water, please use the
option "Zero force
“ by pressing the
icon in the window for editing the calibration curve
(see Figure 37).
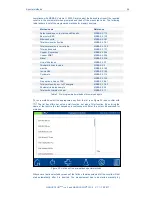
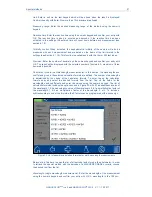
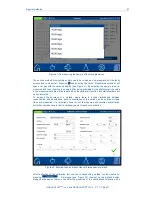
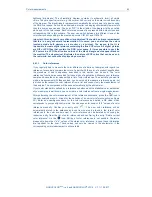
Calculation formula:
In this section, the wavelengths and the coefficients specified in the
selected caluclation formula are defined. The number of wavelengths is determined by the
choice of the calculation formula. Tap on the calculation formula entry and select the desired
formula from the list. Tap on the fields for the wavelengths and coefficients to enter the
values via a numeric keypad
.
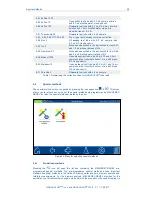
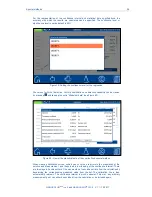
The list of calculation formulas includes the options shown in
Figure 33, with E1 as absorbance value of the wavelength 1, E2 as absorbance value of
wavelength 2, K1 as a multiplication factor of the wavelength 1, K2 as a multiplication factor
of the wavelength 2, etc. To include a subtraction step in one of the formulas, the K factors
can be programmed with a minus sign.
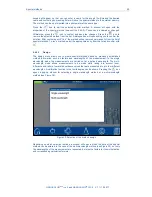
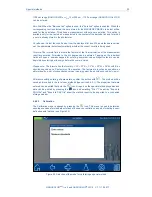
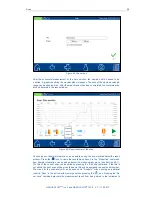
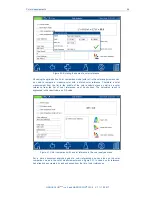
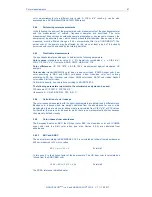
In the
“Enter values” mode, the calibration curve will be calculated and displayed by pressing
. In the
“Measure standards” mode, enter all of the parameters and start the
measurement by pressing
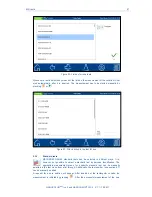
. The photometer will ask you to insert in succession the
sample solutions in the concentrations entered previously (see Figure 36). The first
measurement is always the measurement of the zero solution. The user must decide
independently whether to make a zero measurement against a reagent blank value or
whether to use water as a reference. The measurement series is created by inserting the
cuvettes in the given order. The progress of the measurement series is indicated by a
progress bar.
Figure 36: Measurement procedure for the calibration of a user-defined special method
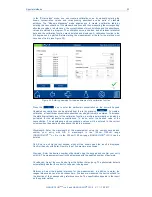
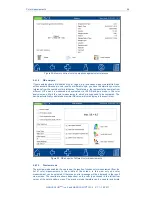
After the last cuvette has been removed from the photometer, all statistical parameters will
be calculated and plotted as shown in Figure 37.
Summary of Contents for NANOCOLOR UV/VIS II
Page 1: ......