


Color measurements
46
NANOCOLOR
®
UV
/
VIS
II and
NANOCOLOR
®
VIS
II V 1.1 / 10.2017
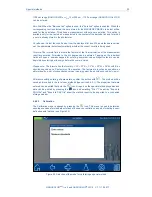
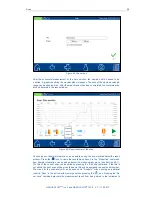
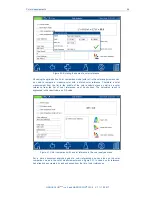
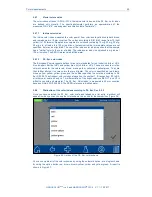
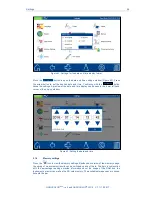
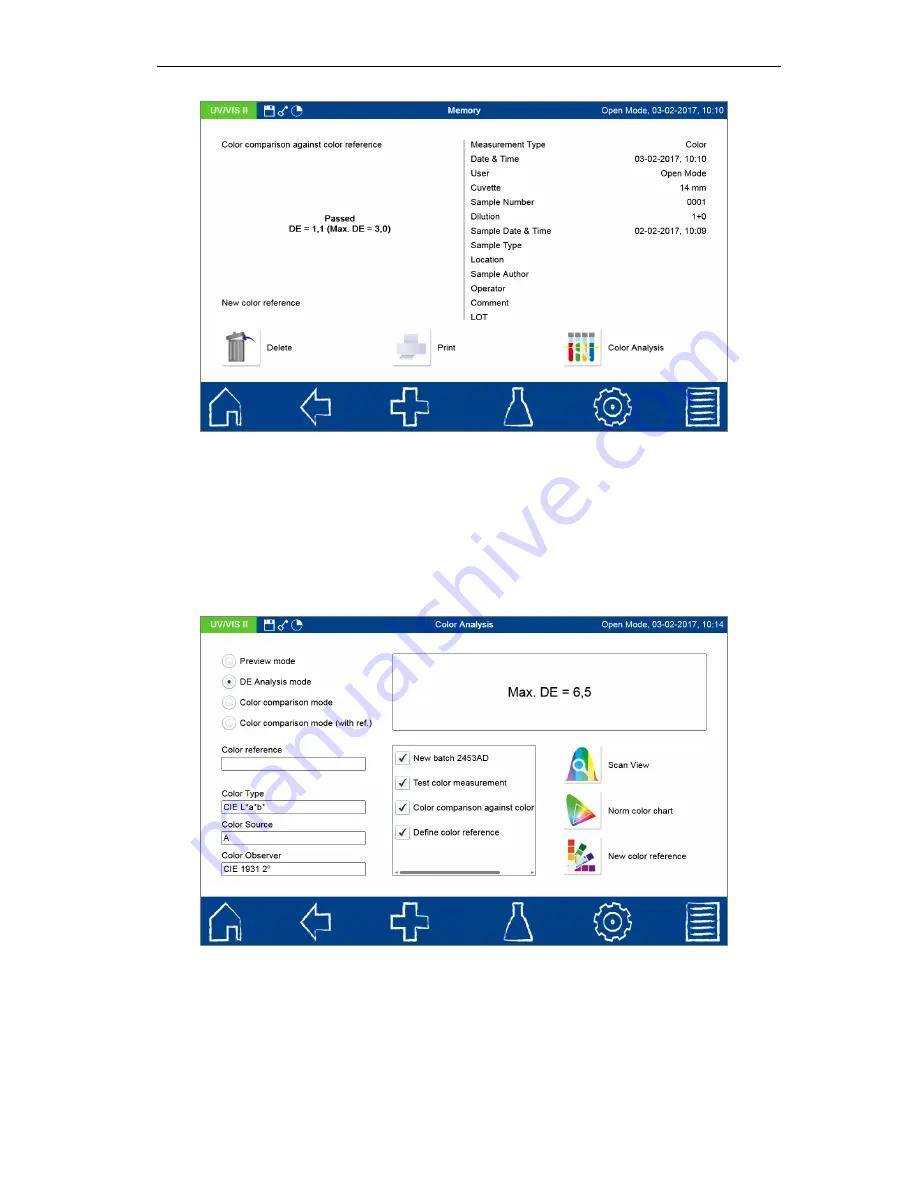
Figure 54: Memory entry of color comparison against color reference
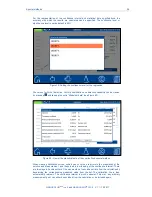
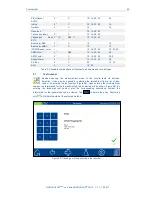
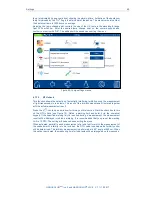
5.6.1.2
DE analysis
If your samples show a distribution of color values, e.g. lemonades made of natural fruit juice
with seasonal differences in color quality or different origin, you have to determine your color
reference from the samples color distribution. Therefore e.g. ten representative samples from
different LOTs can be measured and evaluated via the DE analysis mode in the color
analysis menu. Mark the color measurements, which are supposed to be compared. The
device automatically calculated a maximal DE value, which is display in the result view.
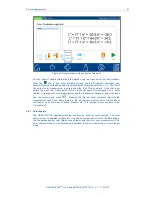
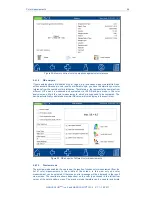
Figure 55: DE analysis of different color measurements
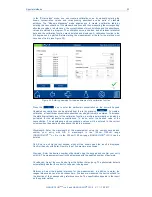
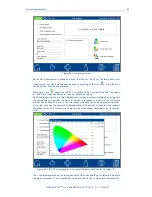
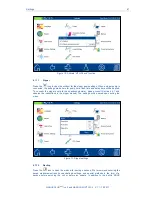
5.6.1.3
Preview mode
The preview mode enables the use to see the results of chosen color measurement from the
list of color measurements in the middle of the screen. In this view only one color
measurement can be selected. Otherwise an error message will be displayed in the result
view screen. The results are shown dependent on the color type chosen in the left bottom
corner of the color analysis menu. The preview mode therefore can be used to recalculate
Summary of Contents for NANOCOLOR UV/VIS II
Page 1: ......