12. VECTORSCOPE DISPLAY
111
12.8 5 Bar Display
12.8.1
5 Bar Screen Description
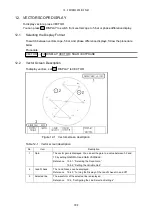
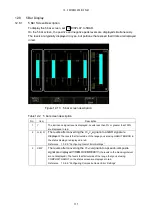
To display the 5 bar screen, set
DISPLAY to 5BAR.
On the 5 bar screen, the positive and negative peak levels are displayed simultaneously.
The levels are typically displayed in cyan, but portions that exceed their limits are displayed
in red.
Figure 12-13 5 bar screen description
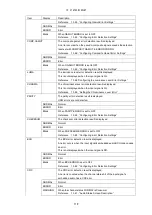
Table 12-2 5 bar screen description
No.
Item
Description
1
Y
The luminance signal level is displayed. Levels less than 0% or greater than 100%
are displayed in red.
2
G, B, R
The levels after converting the
YC
B
C
R
signal into a GBR signal are
displayed.
The levels that fall outside of the range you set using GAMUT ERROR in
the status display are displayed in red.
Reference 13.6.5, “Configuring Gamut Error Settings”
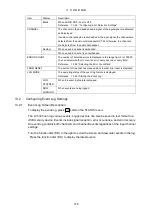
3
CMP
The levels after converting the
YC
B
C
R
signal into a pseudo-composite
signal are displayed !!!REMOVE BREAK!!!
(the levels in the blanking interval
are not displayed). The levels that fall outside of the range that you set using
COMPOSIT GAMUT on the status screen are displayed in red.
Reference 13.6.6, “Configuring Composite Gamut Error Settings”
F•6

