Lantronix
SM12XPA Web User Guide
33848 Rev. A
Page
257
of
473
Alarm
Status
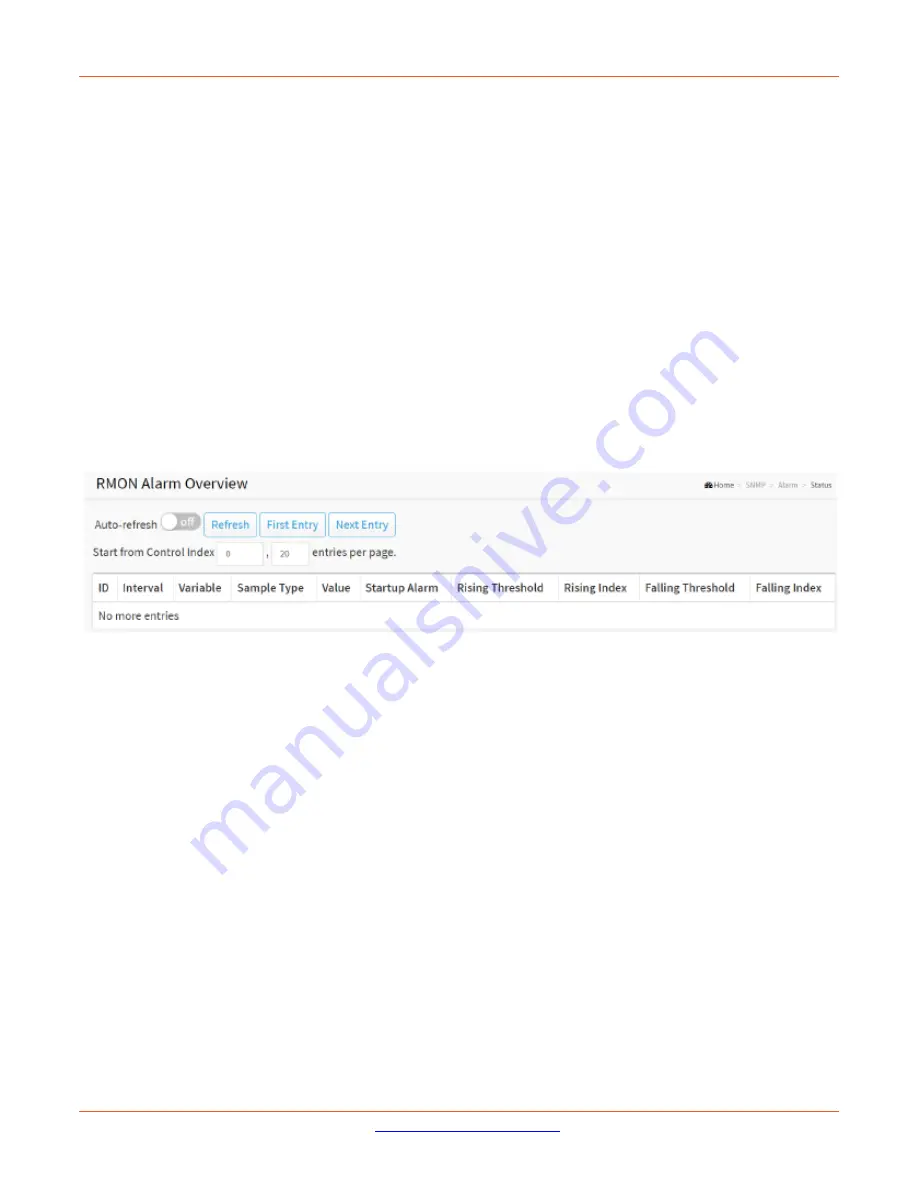
This page provides an overview of RMON Alarm entries. Each page shows up to 99 entries from the Alarm table,
default being 20, selected through the "entries per page" input field. When first visited, the web page shows the
first 20 entries from the beginning of the Alarm table. The first displayed will be the one with the lowest ID
found in the Alarm table.
The "Start from Control Index" lets you select the starting point in the Alarm table. Clicking the Refresh button
will update the displayed table starting from that or the next closest Alarm table match.
The Next Entry will use the last entry of the currently displayed entry as a basis for the next lookup. When the
end is reached the text "
No more entries
" displays in the table. Use the First Entry button to start over.
Web Interface
To display RMON Alarm Status in the web UI:
1.
Click SNMP, Alarm, and Status.
2.
Check “Auto-refresh”.
3.
Click “Refresh” to refresh the port detailed statistics.
4.
Click First Entry/Next Entry to change Entry.
Figure 13-5.2: RMON Alarm Status
Parameter descriptions
:
ID
: Indicates the index of Alarm control entry.
Interval
: Indicates the interval in seconds for sampling and comparing the rising and falling threshold.
Variable
: Indicates the particular variable to be sampled
Sample
Type
: The method of sampling the selected variable and calculating the value to be compared against
the thresholds.
Value
: The value of the statistic during the last sampling period.
Startup Alarm
: The alarm that may be sent when this entry is first set to valid.
Rising Threshold
: Rising threshold value.
Rising Index
: Rising event index.
Falling Threshold
: Falling threshold value.
Falling Index
: Falling event index.
Start from Control Index
: Lets you select the starting point in the table.
entries per page
: You can choose how many items you want to show per page.

