FUNS
The FUN Equations
16-7
.5625
.625
10
5*
.625
.6875
11
6
.6875
.75
12
6*
.75
.8125
13
7
.8125
.875
14
7*
.875
.9375
15
8
.9375
1
16
8*
As an example, consider the FUN we set up at the beginning of the previous section: the Mod
Wheel was assigned as
input a
, and the data slider as
input b
. The FUN was assigned as Src1
on the PITCH page, and the depth of Src1 was set to 1200 cents. If you push the Mod Wheel all
the way up, the value of
input a
will be +1. This will set the number of steps at 8, since the data
slider sends a unipolar control signal. With your MIDI controllerÕs data slider at minimum,
play and sustain a note. Then move the data slider slowly up. The pitch of the note will jump
up an octave in 8 steps as you move the data slider all the way up.
If the value of
input a
is negative, itÕs multiplied by -1, so its value always falls within the
ranges above. When
input b
is bipolar and the resulting number of steps is an odd number, the
steps are centered around a value of 0Ñthat is, the center step is equivalent to no effect from
input b
. When the number of steps is even, a value of zero is not included in the steps. This is
also true for the values marked by an asterisk when input b is unipolar.
lowpass (f = a, b)
This equation might be called a lag equation. Its effect is to introduce a delay in the K2vxÕs
response to changes in the value of
input b
. It works by Þltering (reducing) higher values of
input b
. The value of
input a
determines the degree to which the values of
input b
are Þltered.
Low values for
input a
will induce a long lag when the value of
input b
changes. High values
will shorten the lag. When
input b
remains constant at a high level, low values of
input a
will
cause the FUN to sweep up slowly from 0 to the value of
input b
. Higher values for
input a
will
cause the FUN to sweep more rapidly.
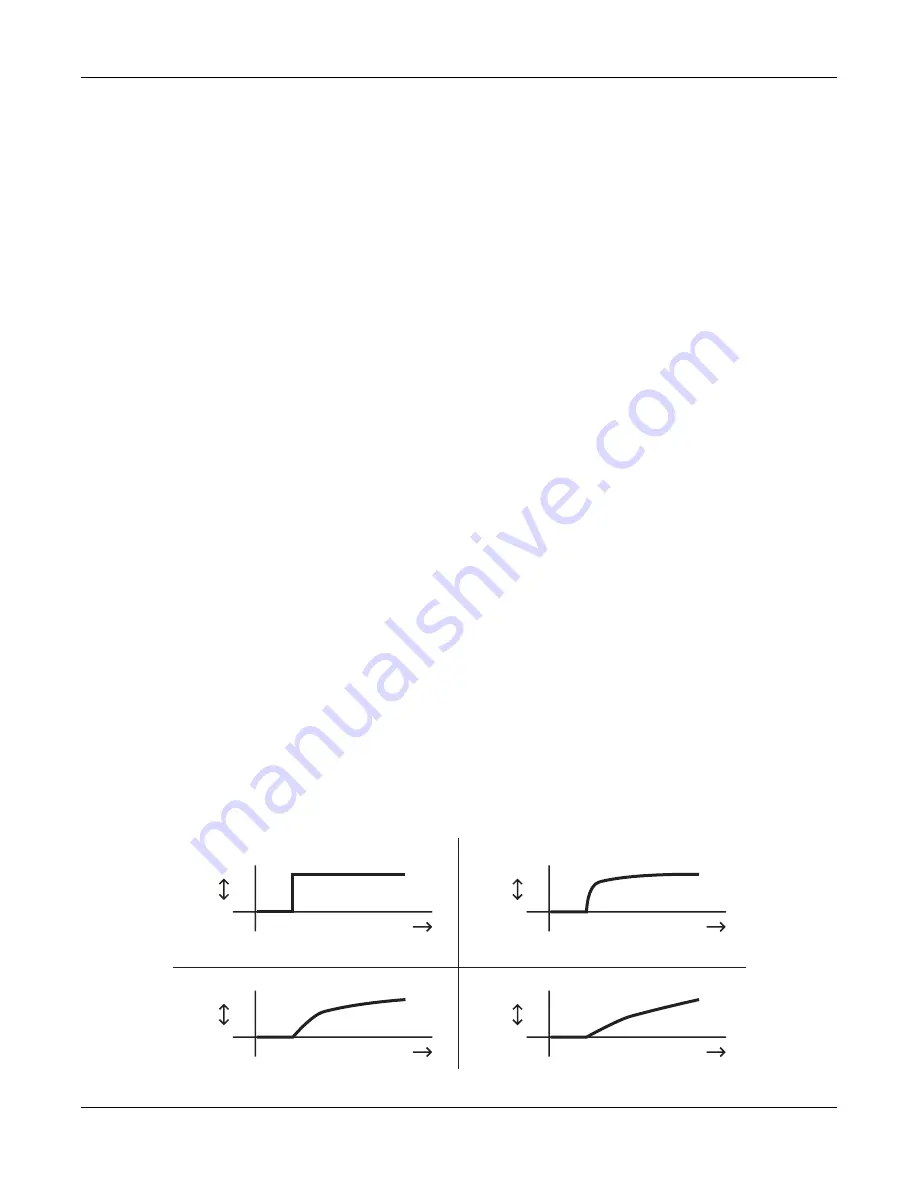
The four graphs below show the effect of different values for
input a
on the change of
input b
.
In each graph, the value of
input b
jumps from 0 to +1. In graph 1, the value of
input a
is +1.
Each successive graph represents the same change in the value of
input b
, at successively lower
values for
input a
.
This equation works as intended only when the value of
input a
is 0 or positive. Negative
values for
input a
will result in a much less predictable response than positive values. You
might like the effect, but it wonÕt be anything like what weÕve just described.
input b
value
time
input b
value
time
input b
value
time
input b
value
time
1)
4)
3)
2)
Summary of Contents for K2500RS
Page 12: ...Table of Contents TOC 12...
Page 16: ...Introduction How to use this manual 1 4...
Page 32: ...User Interface Basics The Panel Play Feature K2vxR 3 8...
Page 106: ...Effects Mode and the Effects Editor Configurations and Parameters 9 24...
Page 186: ...Song Mode Recording Multi timbral Sequences via MIDI 12 52...
Page 304: ...DSP Functions Hard Sync Functions 14 52...
Page 394: ...Programs Setups and Keymaps K2500 ROM Keymaps 21 12...
Page 402: ...LFOs LFO Shapes 23 4...
Page 406: ...Note Numbers and Intonation Tables List and Description of Intonation Tables 24 4...
Page 434: ...DSP Algorithms 26 14...
Page 450: ...MIDI and SCSI Sample Dumps SMDI Sample Transfers 29 8...
Page 464: ...Glossary 31 6...
Page 490: ...K2vx Program Farm VOX K25 Appendix A 22...
Page 494: ...K2vx Compatibility Converting programs from the K2vx to K2000 Appendix B 4...


