Chapter II
– The BAX® System X5 Software
BAX® System X5 User Guide
19
The
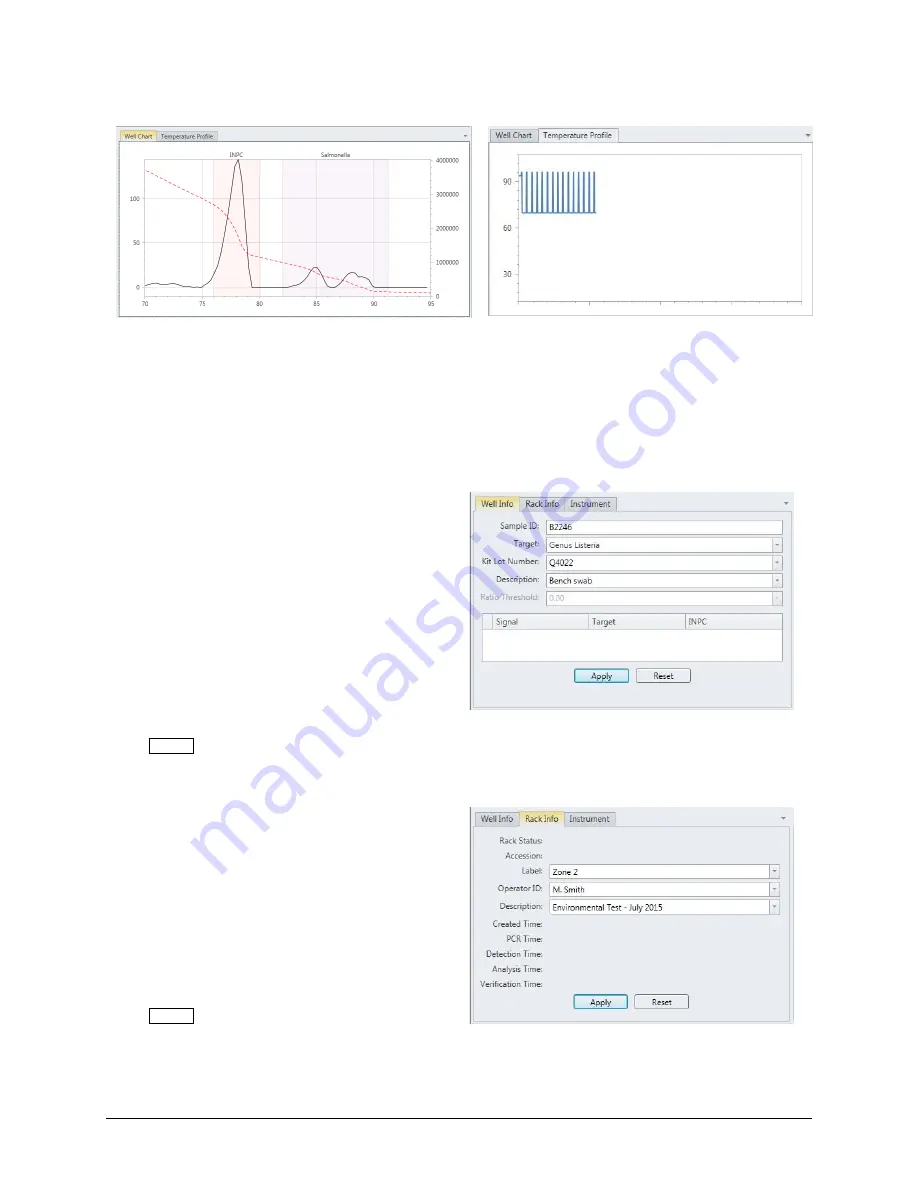
Graph Tabs
switch between viewing the Well Chart (graph of the results for a specific sample) or the
Temperature Profile (graph of the heating/cooling cycles during a process run)
After the process run is complete, the
Well Chart
displays a
graphical representation of the sample results. The shaded regions
denote different areas of interest in the assay.
During a process run, the
Temperature Profile
tab displays a
live graph of the heating/cooling cycles. When the process
run in complete, this tab is blank.
Creating a Rack File
In the Well Info Tab -
Highlight the desired sample well (or wells) and enter
information about each individual sample
–
•
Sample ID
(optional)
– Enter identifying
information for the sample well
•
Target
(required)
– Select the proper target
for the sample from the drop-down menu
•
Kit Lot Number
(recommended)
– Enter the
lot number of the BAX® System assay you
are using to process the samples
•
Description
(optional)
– Enter a short
description of the sample
Click APPLY to save the entered information.
In the Rack Info Tab -
Highlight the desired sample well (or wells) and enter
information about all samples in the process run
–
•
Label
(optional)
– Enter identifying
information for the entire sample rack
•
Operator ID
(optional)
– Enter identifying
information for the person setting up the
process run
•
Description
(optional)
– Enter a short
description of the entire sample rack
Click APPLY to save the entered information.


