Monitoring and Analyzing Switch Operation
Status and Counters Data
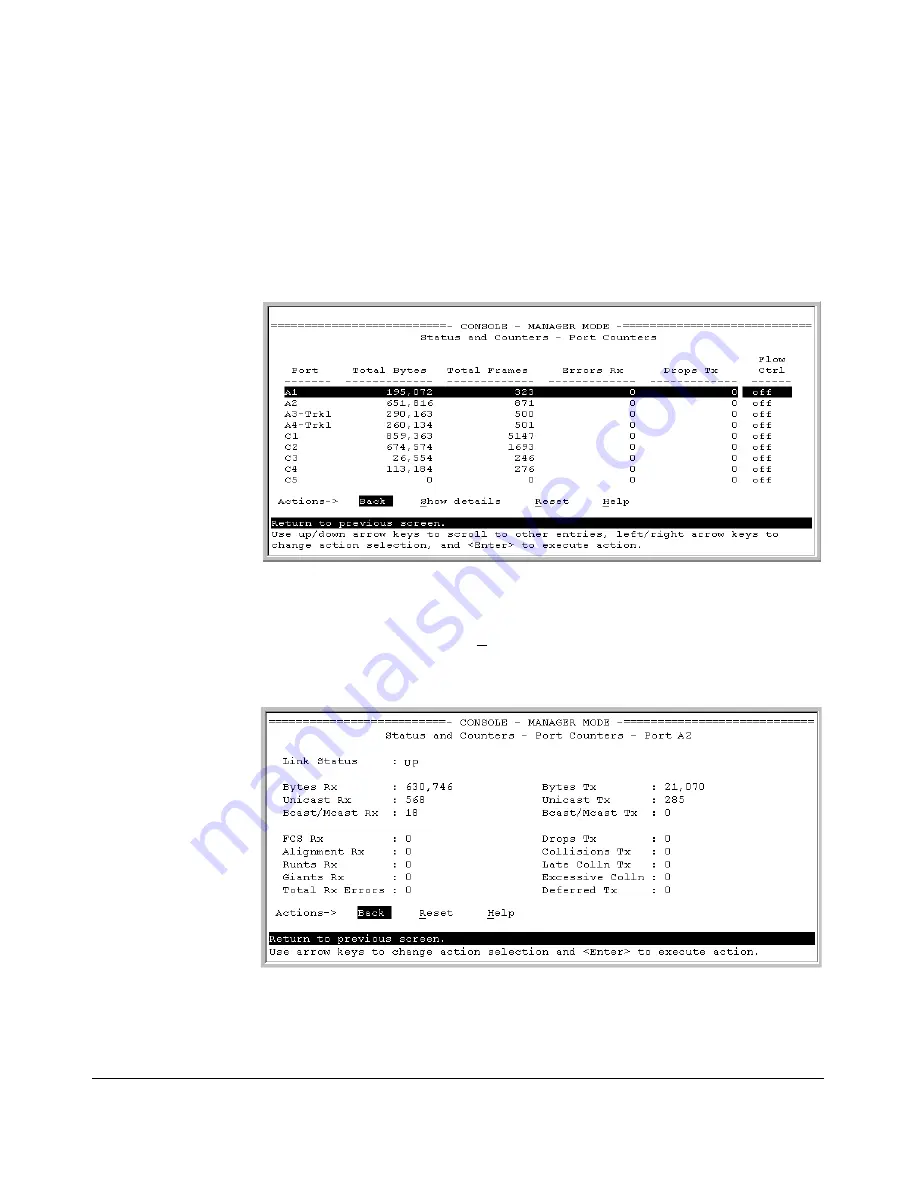
Menu Access to Port and Trunk Statistics
To access this screen from the Main Menu, select:
1. Status and Counters …
4. Port Counters
Figure B-7. Example of Port Counters on the Menu Interface
To view details about the traffic on a particular port, use the
[v]
key to highlight
that port number, then select
Show Details
. For example, selecting port A2
displays a screen similar to figure B-8, below.
Figure B-8. Example of the Display for Show details on a Selected Port
This screen also includes the
Reset
action for the current session. (Refer to
the “Note on Reset” on page B-11.)
B-12
Summary of Contents for PROCURVE 2520
Page 2: ......
Page 3: ...HP ProCurve 2520 Switches November 2009 S 14 03 Management and Configuration Guide ...
Page 60: ...Using the Menu Interface Where To Go From Here 3 16 ...
Page 82: ...Using the Command Line Interface CLI CLI Editing Shortcuts 4 22 ...
Page 146: ...Switch Memory and Configuration Automatic Configuration Update with DHCP Option 66 6 40 ...
Page 164: ...Interface Access and System Information System Information 7 18 ...
Page 292: ...Port Trunking Outbound Traffic Distribution Across Trunked Links 12 30 ...
Page 374: ...Configuring for Network Management Applications LLDP Link Layer Discovery Protocol 13 82 ...
Page 434: ...Monitoring and Analyzing Switch Operation Locating a Device B 30 ...
Page 514: ...Troubleshooting DNS Resolver C 80 ...
Page 524: ...Daylight Savings Time on ProCurve Switches E 4 ...
Page 542: ...16 Index ...
Page 543: ......


