PROCESS INFORMATION DISPLAYS
6510020335
147
Profile Type Description
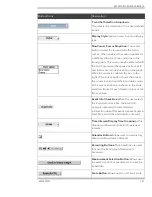
Average
Average is the average value of the data for the displayed variable, which
includes the data that is not shown when zoomed in. If the variable is
being displayed around average, a green arrow is shown to the right of
the label.
Visible
Visible column shows the visibility of the Y-axis and profile for the
selected profile. If Y-axis of the selected profile is visible then the text in
the respected column is changed to “Yes” and if Y
-axis is not visible then
text in t
he respective column is changed to “No”.
X-Axis
X-Axis shows the visibility of the X-axis for the selected profile. If X-axis is
visible then text is displayed as “ON” else the column is left blank.
Frozen At
When you click the Frozen At column forth respective profile, the frozen
time is displayed in the column with yellow text color and the profile color
is set to yellow. When this column is clicked second time, the frozen time
disappears and column is left blank and the frozen profile disappears
from the display, and the frozen profile is saved locally. It this
measurement is viewed on a different display on the same station (if
different display is using the same measurement profile HMIWeb
component), the frozen status is still maintained. However, that frozen
profile will not be available on stations other than the one on which the
frozen request was made. It is also operator-independent, so if an
operator freezes a profile and logs out, anyone else who logs into that
station can see the frozen profile. The frozen information is not lost if the
machine is restarted.
6.10.3
Scale Information
Fig. 132.
Scale Button
Scale column allows a user to scale the measurement data on the profiles. Click on the
scale column and the
QcsScalingSelection
popup appears.
Summary of Contents for Experion MX
Page 1: ...Experion MX RELEASE 702 1 Operators Guide 6510020335 Rev 02 May 2019 ...
Page 7: ...6510020335 7 8 NOTICES 168 ...
Page 20: ...SCANNER SAFETY AND LOCAL CONTROLS 6510020335 20 Fig 15 Cable End Voltage Zones ...
Page 21: ...SCANNER SAFETY AND LOCAL CONTROLS 6510020335 21 Fig 16 Distant End Voltage Zones ...
Page 124: ...PROCESS INFORMATION DISPLAYS 6510020335 124 Fig 105 Profile Display ...
Page 159: ...PROCESS INFORMATION DISPLAYS 6510020335 159 Fig 148 Precision Platform 4000 01 Scanner ...
Page 160: ...PROCESS INFORMATION DISPLAYS 6510020335 160 Fig 149 Precision Platform 4000 20 21 Scanner ...


