


Appendix 9 Definitions
A
15
A
Unbalance
Factor
Because of the fluctuation of
loads on each phase, such as
when used for motive power or
operation of machinery that load
the phases unevenly, some
phases may be more heavily
loaded, causing more voltage or
current waveform distortion on
some phases than on others as
a result of voltage drop or
reactive voltage.
Voltage unbalance, reverse-
phase voltage and harmon-
ics can cause accidents re-
sulting from occurrence such
as unstable motor rotation,
tripping of 3E breakers and
transformer thermal over-
load.
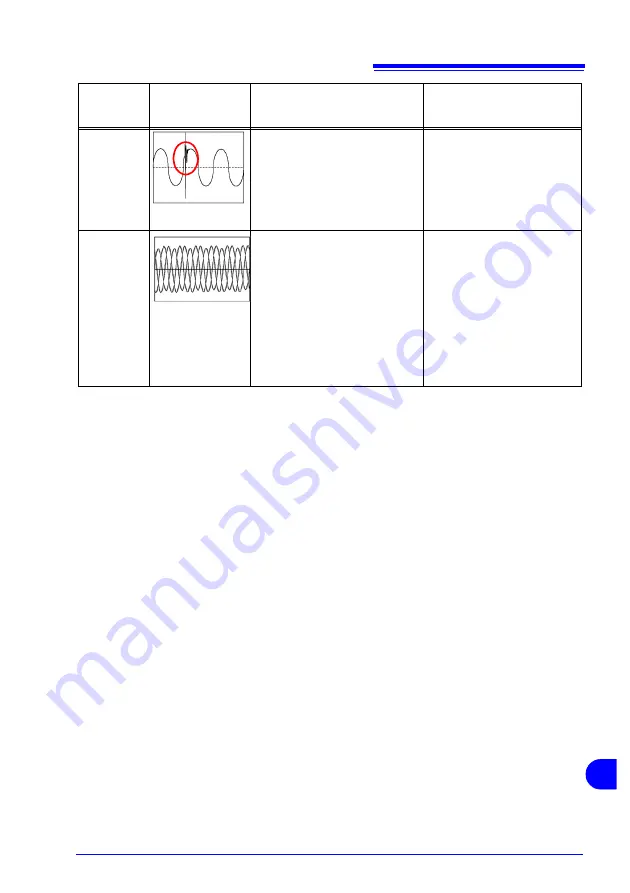
Power
Quality
Parameter
Waveform Display Phenomenon
Related Malfunctions
Transient
Overvoltage
(Impulse)
Occurs typically as a result of
lightning, circuit breaker trip-
ping, fouled relay contacts or
load shutdown.
Many cases exhibit abrupt
voltage changes and high peak
voltage.
Near the source of the phe-
nomena, power devices may
sustain damage or opera-
tions reset abruptly because
of the especially high volt-
age.
Summary of Contents for 3197
Page 1: ...3197 POWER QUALITY ANALYZER May 2012 Revised edition 7 3197A981 07 12 05H Instruction Manual ...
Page 2: ......
Page 8: ...Contents vi ...
Page 30: ...1 3 Measurement Flowchart 22 ...
Page 44: ...2 5 Internal Operating Status and Memory Usage 36 ...
Page 86: ...4 6 Initializing the Instrument System Reset 78 ...
Page 134: ...6 4 Viewing Recorded Data REVIEW State 126 ...
Page 176: ...9 4 Disposing of the Instrument 168 ...
Page 199: ......
Page 200: ...3197 POWER QUALITY ANALYZER May 2012 Revised edition 7 3197A981 07 12 05H Instruction Manual ...


