71
Use the furthest migrating calibration protein as the reference
point. With SDS-PAGE, use the tracking dye position as the
reference point.
7.
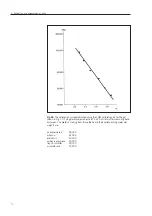
Plot the R
f
, values of calibration kit proteins against the
logarithms of their molecular weight.
8.
Calculate the R
f
, value for the sample protein(s). Interpolate their
corresponding log molecular weight from the calibration plot.
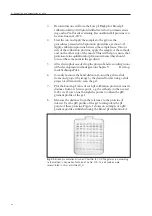
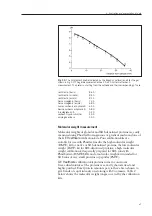
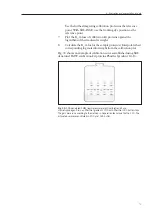
Fig. 35 shows an example of calibration curves established using SDS
denatured LMW calibration kit proteins PhastGel gradient 10-15.
Fig. 35.
SDS denatured LMW (low molecular weight) calibration kit and
chymotrypsinogen A run an PhastGel gradient 10-15 with PhastGel SDS buffer strips
The gels were run according to the method in Separation technique file No. 110. The
kit proteins were reconstituted in 200 µl of SDS buffer.
6. Evaluation and presentation of data

