Bridge GUI Guide: Monitoring
169
(
No Lines
). The legend in the top right corner of the screen
shows what the lines depict and the relative ranges indicated
by Green, Yellow, and Red status colors.
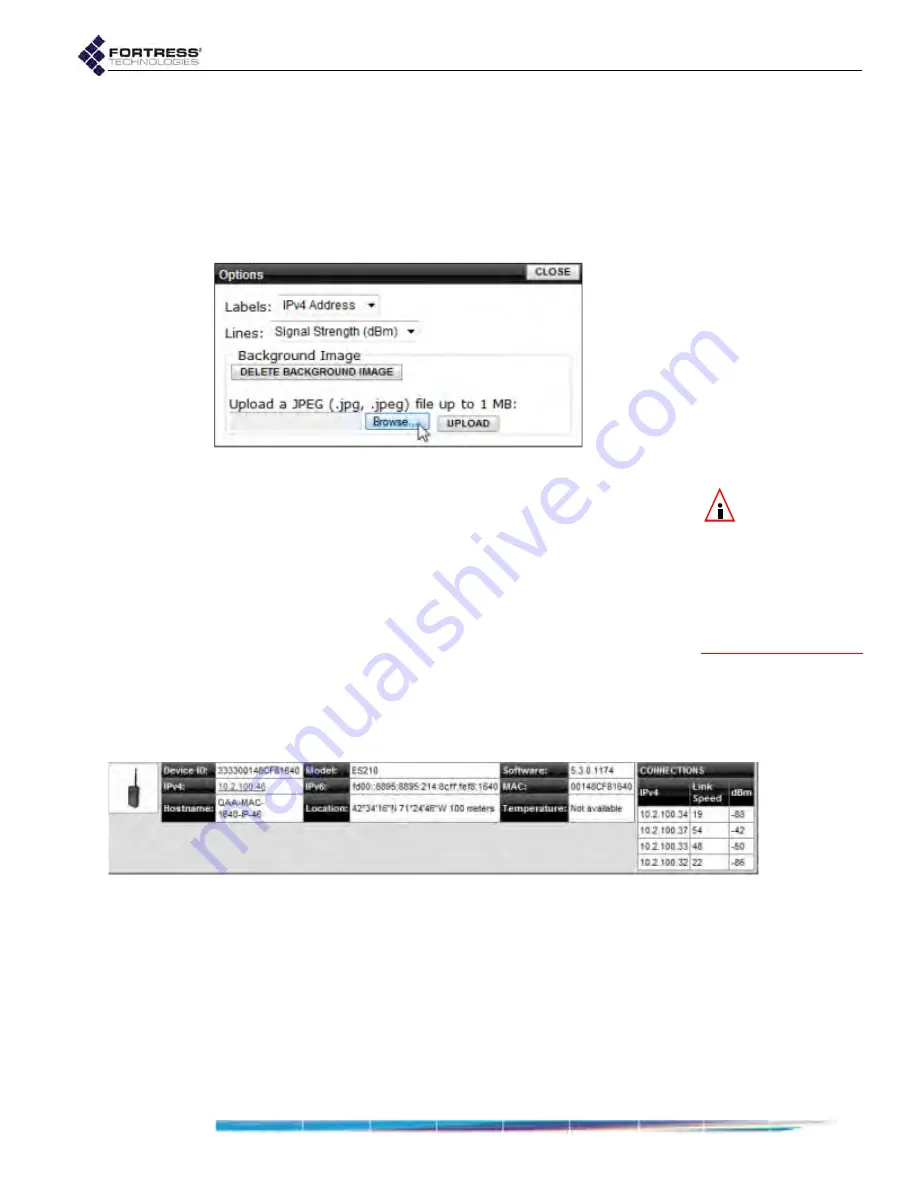
By default, Bridges in the
Topology View
are labeled with their
IPv4 addresses. Alternatively, you can change the
OPTIONS
to
label network Bridges by
Hostname
,
IPv6 Address
,
MAC Address
,
Device ID
, or
No Labels
.
Figure 5.5. Topology View Options dialog, all radio-equipped platforms
NOTE:
Clicking an
Arrange
icon over-
rides each bridge’s pre-
vious placement, so you
may not want to use
these icons if you have
spent time manually
dragging each node into
place.
You can view the nodes on the default grid or you can upload a
map or satellite image of your location to use as the
background for the
Topology View
(refer to Section 5.4.1). If you
use your own image, you can then manually place each of the
nodes near their physical location to make the view more
representative.
Alternatively, you can use the
Arrange
icons at the top of the
screen to view the nodes in a grid, ellipse or in an STP tree
configuration based on the STP root. The STP tree view is not
available until an STP root has been discovered, which can
take a few seconds after the page loads. In STP tree view, the
zoom buttons are disabled and the background image and
associated options are hidden.
Figure 5.6.
Topology View
device details frame (for an ES210), all radio-equipped platforms
Click any Bridge icon to open a frame at the bottom of the
screen. The frame displays the selected Bridge’s
Device ID
,
IPv4 Address
,
Hostname
,
Model
,
IPv6 Address
,
Location
,
Software
version,
MAC
Address, and
Temperature
. Any field
that is not available for the selected Bridge is left blank. The
IPv4 Address
serves as a link to that Bridge’s GUI logon
screen.


