Technical Specifications
Valleylab FT10 Energy Platform User’s Guide
10-25
Output Power vs. Resistance Graphs
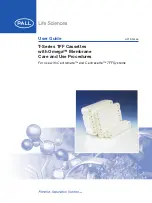
LigaSure
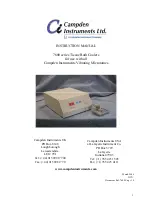
Bipolar Resection
Output Power vs. Resistance Graphs
For the values stated in the graphs provided in this section:
•
Output power is within the greater of 15% or 8 W.
•
Peak voltage includes tolerances.
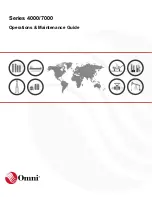
Monopolar Graphs
PURE CUT
Output power versus impedance for Pure CUT power
Output power (watts)
ཱ
Load impedance (ohms)
LIGASURE
434 kHz sinusoid continuous
BIPOLAR RESECTION
434 kHz sinusoid continuous
1
2
100%
50%