Appendix C – APDiagnostics
204
Instruction Manual – Enova DGX 8/16/32/64 Digital Media Switchers
Information Pane
The Information pane is the center panel in the Main Screen and offers the
next level of “drill down” into the system status. Information pane buttons
access information for each of the specific group components listed. The
type of information displayed in the Information pane depends on which
tab is active in the Categories pane and which Categories button is
selected.
To display diagnostic information:
1.
In the Categories pane, select the Diagnostic tab.
2.
Select either the Temperature or Power System buttons as applicable.
3.
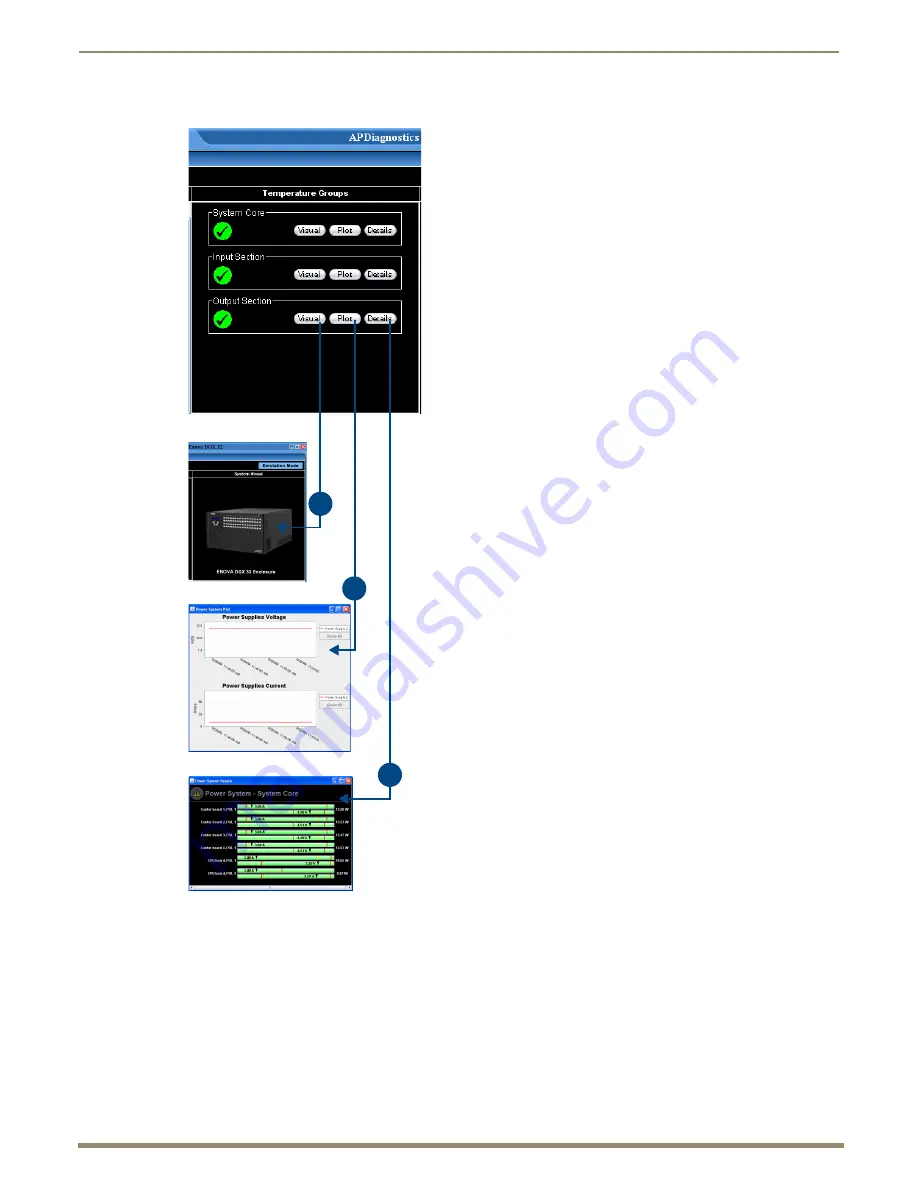
In the Information pane:
b. Click Plot
to display a Plot View with a graph of data points for
information being gathered (Acquisition mode) or already gathered
(Emulation mode) for a specific component. The data is date stamped
as it is added to the graph.
For more information, see page 205.
c. Click Details
to display a set of analog status meters each
representing current data for its associated component.
The meters provide an analog representation of a component’s
current value with respect to its Warning and Error setpoints.
If the value is below its minimum or exceeds its maximum Warning
or Error setpoint, the color of the meter changes from green (Good)
to yellow (Warning) or red (Error), making problem areas easy to
identify at a glance.
a.
b.
c.
a. Click Visual
to display visual details on the enclosure in the
System Visual pane.
For more information, see page 206.


