12
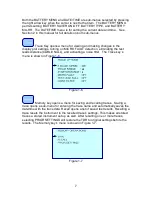
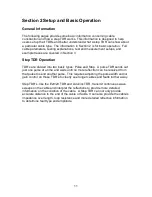
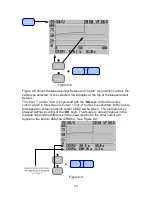
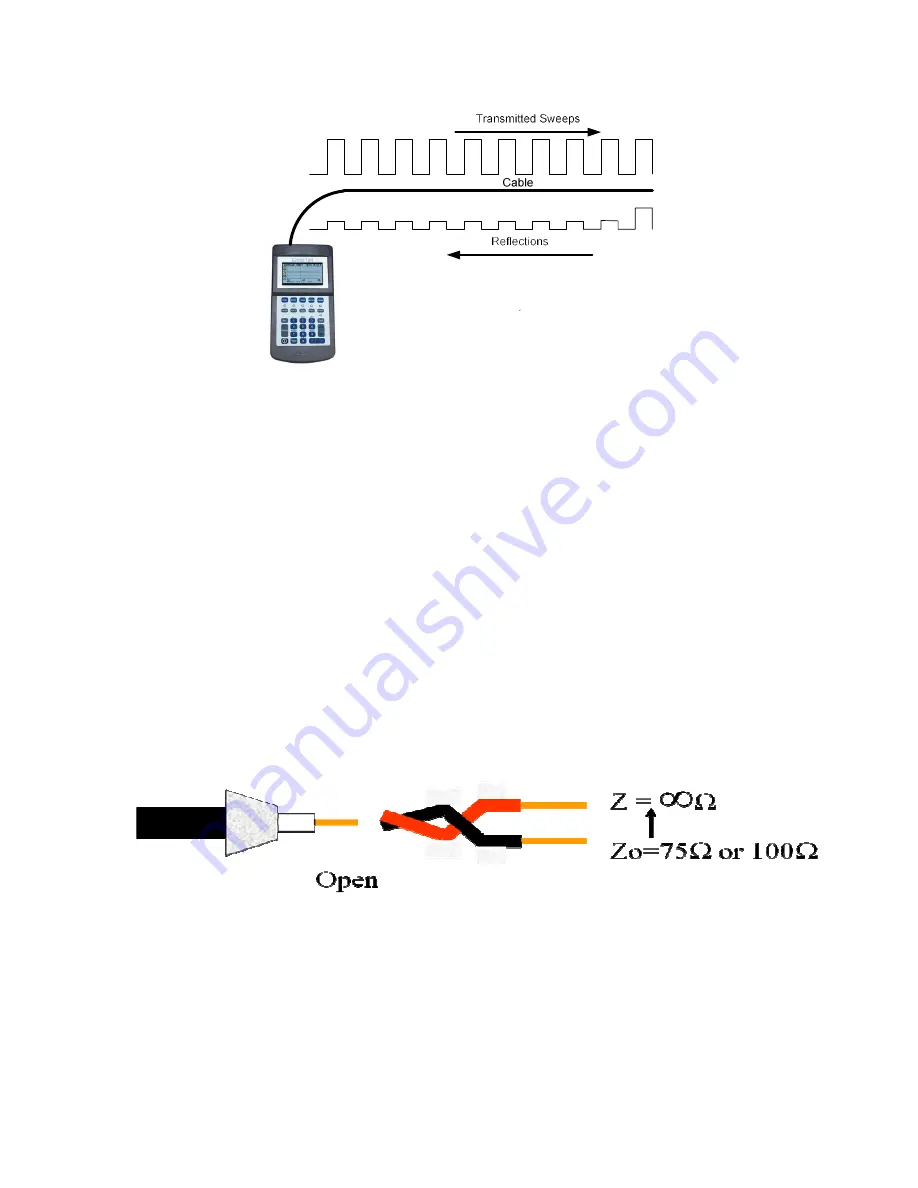
Figure 2-1
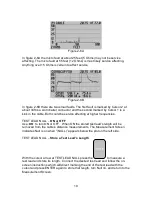
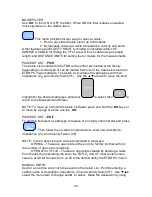
Figure 2-1 is a representation of the sweep sent by a Step TDR. The wave is
uniform at any range setting and the TDR calibrates to the range selected by the
user and the cable’s velocity factor used. The result is accurate measurements
both in distance and fault amplitude. In a Step TDR, the same 10 Ohm fault will
show up as 10 Ohms, no matter what distance it is detected.
Impedance Effects
The impedance measured along the length of a good cable is known as the
characteristic impedance (Z
0
) and is designed in at the time of manufacture.
When measuring with a TDR, the readings displayed are the actual impedance
(Z) at each data point along the cable. When a cable is good, you will see
impedance readings that are near or equal to Z
0
. When a fault occurs the
impedance deviates from Z
0
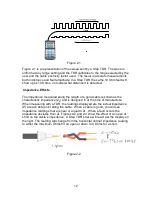
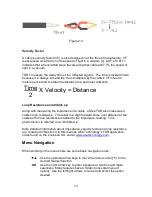
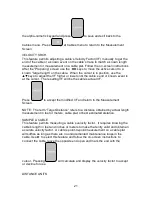
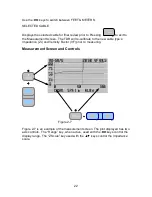
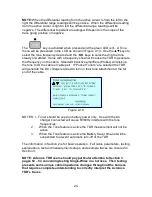
. Figures 2-2 and 2-3 show the effect of an open or
short on the cable’s impedance. A Step TDR’s trace will react per the display on
the right. The reading will change from the horizontal normal impedance reading
to either the maximum Ohms for an open or down to 0 Ohms for a short.
Figure 2-2

