93
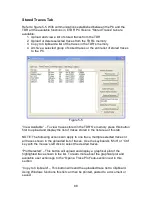
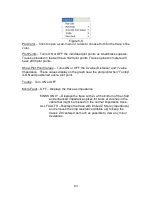
Figure 5-9
Plot Color – Click to open a sub-menu of colors to choose from for the trace’s line
color.
Plot Points – Turns ON or OFF the individual plot points as small black squares.
Traces uploaded in feet will have 1920 plot points. Traces upload in meters will
have 2000 plot points.
Show Plot Point Values – Turns ON or OFF the X value (Distance) and Y value
Impedance. These values display on the graph near the plot point when “Tooltip”
is ON and positioned over a plot point.
Tooltip – Turn ON or OFF
Micro Fault – OFF – Displays the trace as impedance
KINKS ONLY – Displays the trace with Z
0
at the bottom of the chart
and enhanced impedance spikes for kinks or crushes in the
cable that might be missed on the normal impedance trace.
ALL FAULTS – Displays the trace with limited Z Scale (impedance)
and removes the loop resistance (dribble up) to keep the
trace’s Z0 centered as much as possible to view any minor
deviations.


