50
TREND AND DATA LOGGING OPERATION
3. When the file is retrieved, use the
drop down box
to select your
4. The data logging program logs data on every thermostat in your
system every 20 minutes. Use the
pull down box
to select the
thermostat you want to analyze.
Enter the From/To date and time range you want to review.
6. You also have the option of viewing the saved data every 20 minutes
or hourly; select one option.
7. Click on the
Continue
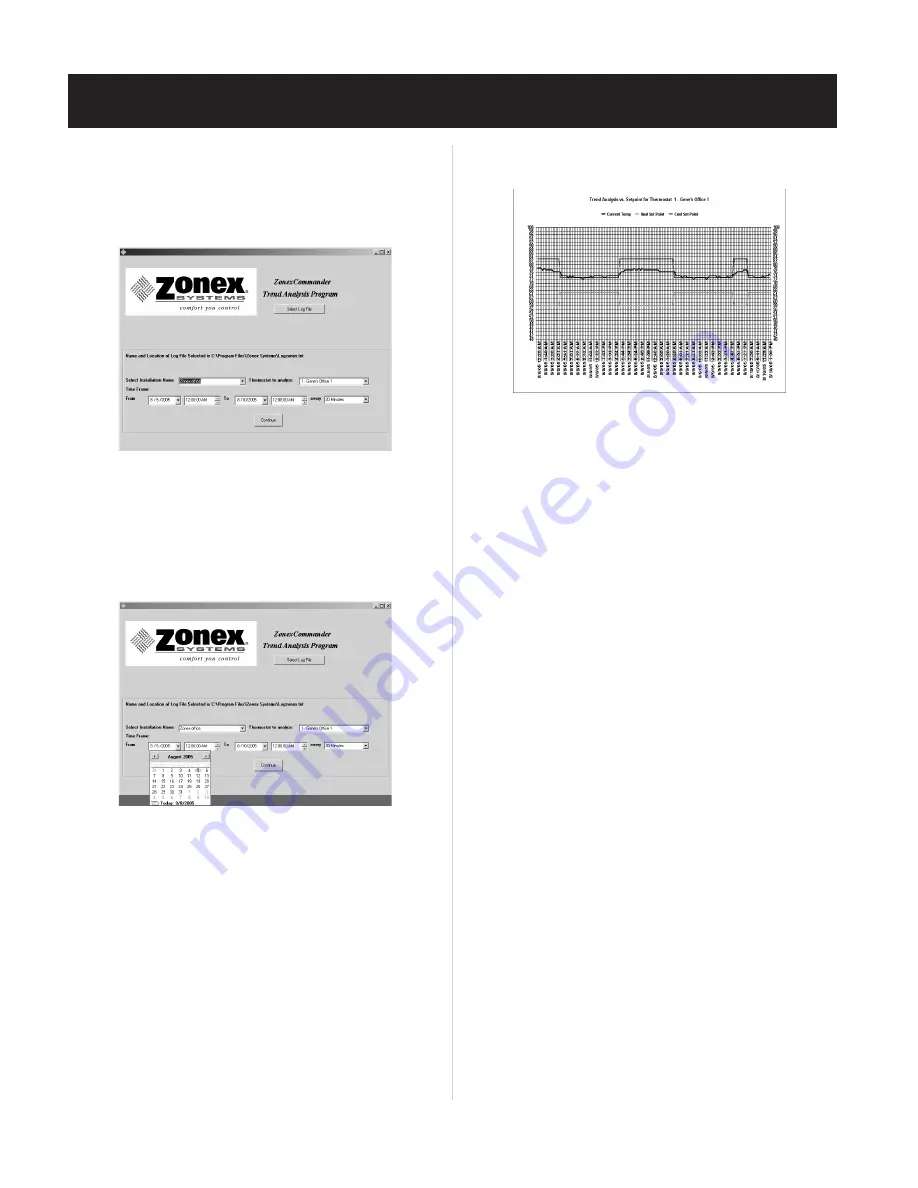
button. The trending program will provide
you with a Trend Analysis Chart reflecting the temperatures of the
desired thermostat vs. the heating and cooling setpoints during the
trending period.
8. The chart displays temperatures from 40-100º in 2º increments on the
9. Different presentations may be prepared by selecting options
listed in the
Chart Type
drop down box. The initial chart is
displayed as a 2d line.
10. A correlation exists between the number of data points and the rows
of data displayed. Reducing the number of rows allows you to zoom
in on the data.
11. To print the Trending Chart, click on the
button; or save it in
your computer as a bitmap (.bmp), which can be e-mailed easily.
12. To generate additional data for other thermostats in the system,
click on the
X
button located at the top of the page to return to
Page 1 of the Trending program. Then select another thermostat you
wish to analyze by using the
drop down
arrow, and the data will be
retrieved quickly.
13. After the data is collected, if you would like to trend Return and
Supply air from each unit:
a. If you are using
SENDCOM
sensors in your system, click on the
Discharge/Return Air Temps
button on the graphing page
associated with that thermostat.
b. If you are using a
ModCom
System, the system’s RA/SA will be
shown as the last entry in the pull down thermostat box. To display,
click on the
Discharge/Return Air Temps
button on the
graphing page. If you are using
SENDCOM
sensors with
stand-alone equipment, that information will follow its
thermostat number.
14. Temperature points on the trend lines can be highlighted by double
clicking on any of the lines (additional data points will appear). By
clicking inside each small box, the temperature at that data point
will be displayed at the bottom of the graph with its value at that
point. Data points will be displayed for any
SENDCOM
assigned to
that specific thermostat number.
Fig. 35
5. A calendar resides in the trending software package
(see Fig. 36)
.
Fig. 36
Y axis, and dates and times are displayed on the X axis
(see Fig. 37)
.
Fig. 37
installation name, thermostat number, and date and time range;
then click the
Continue
button
(see Fig. 35)
. Multiple buildings
can be accessed via the trending program, and files can be saved
under various names.
Содержание ZonexCommander
Страница 13: ...13 ZONEXCOMMANDER WIRING OVERVIEW ROOFTOP UNITS UP TO 20 PER COMMAND CENTER...
Страница 15: ...15 ZONEXCOMMANDER PLUS COMPONENT SELECTION GUIDE...
Страница 53: ......


