EcoWatch for Windows
Section 4
YSI Incorporated
Drinking Water Monitoring Systems Operation Manual
4-9
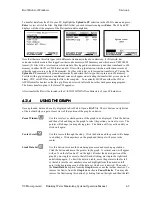
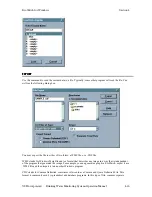
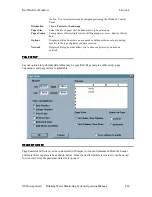
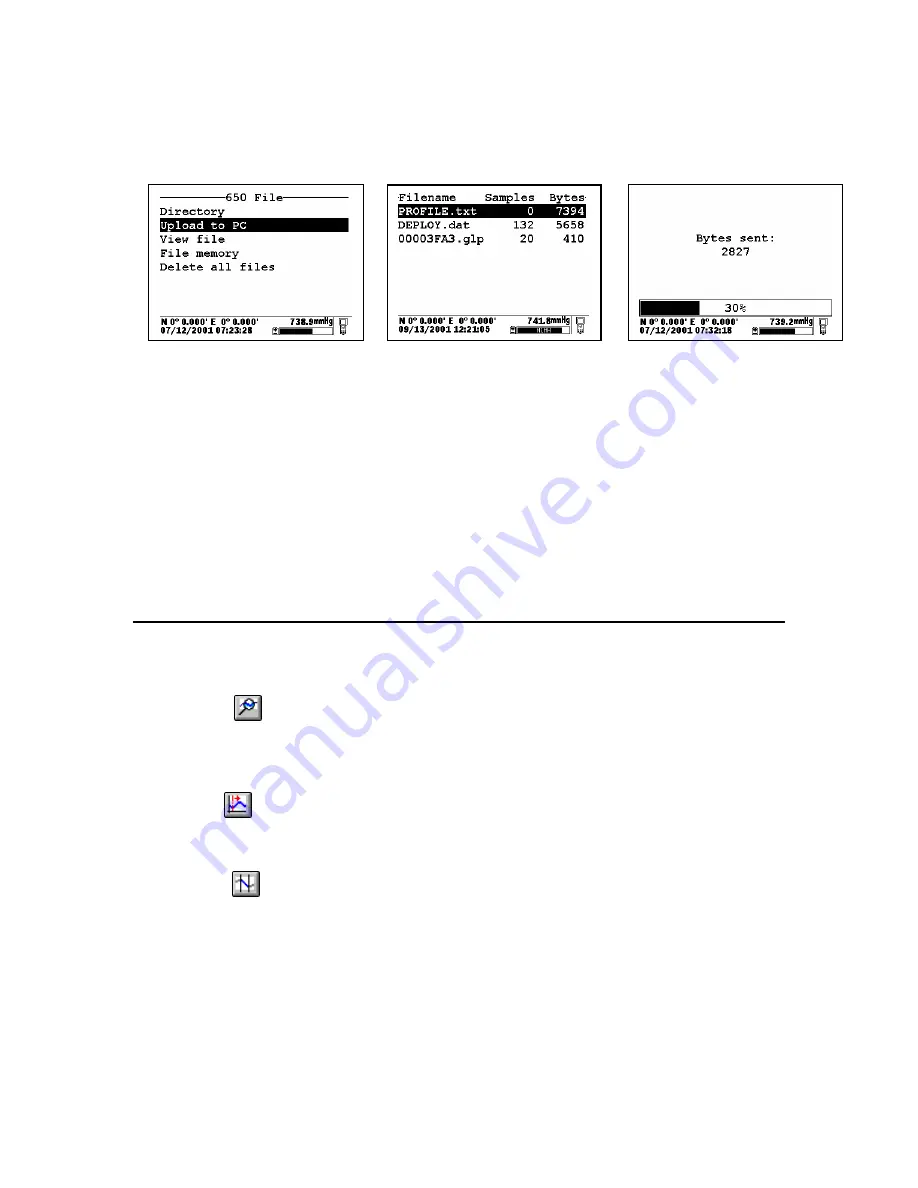
To transfer data from the 650 to your PC, highlight the
Upload to PC
selection in the 650 File menu and press
Enter
to view a list of the files. Highlight the file that you wish to transfer and press
Enter
. The 650 and PC
displays will show the progress of the file transfer until completion.
Note that there are three file types (with different extensions) in the above directory: (1) Files with .dat
extensions which are data files logged to either sonde memory of 650 memory and which are in YSI PC6000
format; (2) Files with a .txt extension which are data files logged to sonde memory and then transferred to 650
memory in either ASCII or CDF format; and (3) Files with a .glp extension which are calibration records of
either the sonde sensors or the 650 barometer. For files with a .dat or .txt extension, transfer to a PC using the
Upload to PC
command will proceed automatically and retain the file type that is present in 650 memory.
For files with a .glp extension, an additional screen will appear on activating the transfer that gives a choice of
binary, CDF, or ASCII for moving the file to the computer. You currently MUST use either the CDF or
ASCII format for transfer so that the .glp file can be viewed in NotePad or other word processing program.
The binary transfer option is for future YSI upgrades.
After transfer the file will be located in the C:\ECOWWIN\DATA subdirectory of your PC hard drive.
4.2.4
4.2.4
4.2.4
4.2.4
USING THE GRAPH
USING THE GRAPH
USING THE GRAPH
USING THE GRAPH
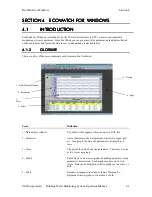
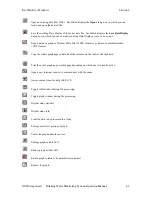
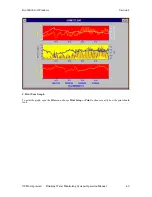
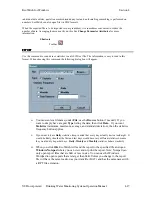
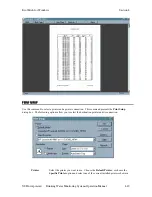
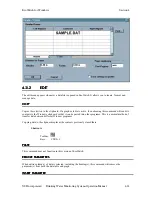
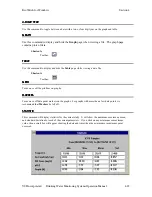
Once uploaded, data can be easily displayed in EcoWatch. Open a
.DAT
file. The six buttons on right side
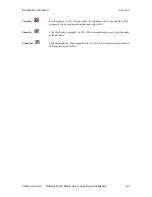
of the toolbar help you get a closer view of that portion of the graph you desire.
Zoom Window
Use this to select a certain portion of the graph to be displayed. Click the button
and then click and drag on the graph to select the portion you want to view. The
pointer will change to a magnifying glass. The button will stay active until you
click on it again.
Center Scroll
Use this to scroll through the study. Click the button and the pointer will change
to a bullseye. Click anywhere on the graph and that spot will move to the
center.
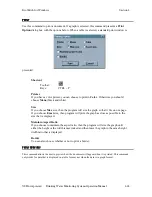
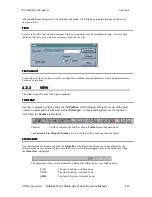
Limit Data Set
Use this button to reduce the data being processed and speed up operations.
Click the button and move the pointer to the graph. A vertical arrow will appear
with an N on the left and an Y on the right. Bracket the desired portion of the
graph by moving the cursor to the left limit, clicking, moving to the right limit
and clicking again. To limit the data in a table, move the pointer to the far left
of the table into the row numbers area and highlight from the desired cutoff
point to the beginning or end of the data set, whichever is desired. Then select
the
Limit Data Set
option from the
Graph
menu or use the toolbar shortcut. To
remove the limits, from the
Graph
menu choose
Cancel Limits
. You may also
remove the limits using this button by clicking first on the right and then the left.
Содержание 600DW-B
Страница 3: ......
Страница 239: ...Principles of Operation Section 5 YSI Incorporated Drinking Water Monitoring Systems Operation Manual 5 26...
Страница 251: ...Warranty and Service Information Section 8 YSI Incorporated Drinking Water Monitoring Systems Operations Manual 8 4...
Страница 259: ...Required Notice Appendix B YSI Incorporated Drinking Water Monitoring Systems Operations Manual B 2...
Страница 264: ...EMC Performance Appendix D YSI Incorporated Drinking Water Monitoring Systems Operations Manual D 2...
Страница 268: ...Specifications Appendix E YSI Incorporated Drinking Water Monitoring Systems Operations Manual E 4...
Страница 297: ......


