page 3 – 21
AM-55 / Sep 2015
A M - 5 5 G U I
The scale on the right side is static and shows the gain reduction of the 5 band leveller/
compressor and
i
AGC at all times.
Three gain values are shown in the lower region. There’s an orange flat line and then
there are two additional lines (yellow and blue) that show the amount of gain reduction
in the 5 band leveller and compressor.
The orange flat line represents the gain reduction of the
i
AGC (in the example above,
the iAGC is at ‑9dB of gain reduction). The yellow line is the fastest gain controller
active. The blue line is the Leveller when the leveller and compressor are active together.
On the left, when both the leveller and compressor
are active, the yellow compressor line “covers up”
the blue leveller line when the leveller and compres‑
sor are at the same value of gain reduction. When the
compressor needs to further reduce gain, you will see
the blue leveller line appear as the compressor adds
more gain reduction, as shown on the right.
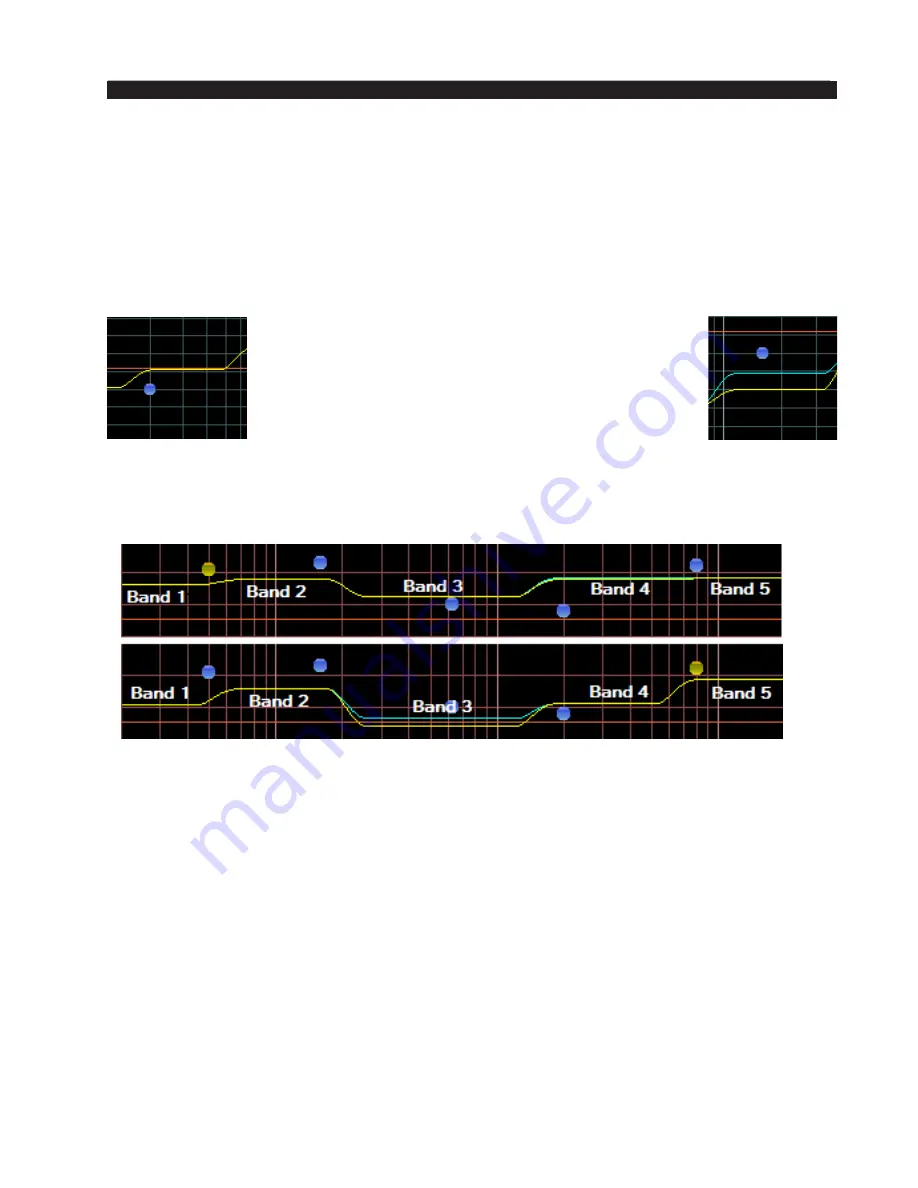
The yellow and blue lines show each band of the 5 band leveller and compressor.
Watching the activity will reveal what is being displayed as the lines will look like they
are “stairs” and will move around and change shape based on the amount of gain reduction
in each band.
In the top example, the leveller and compressor have the same gain reduction values
across the board in each band (with Band 4 about to add more compression as the line
is starting to turn blue). Band 5’s gain reduction value is, at the moment, very similar to
Band 4. Compare that to the example below where Band3 has more compression than
leveller control and Band 4 is deeper into gain reduction than Band 5.


