61
This document is written and published by ShockWatch, Inc. All rights reserved.
USER MANUAL
EVENTS
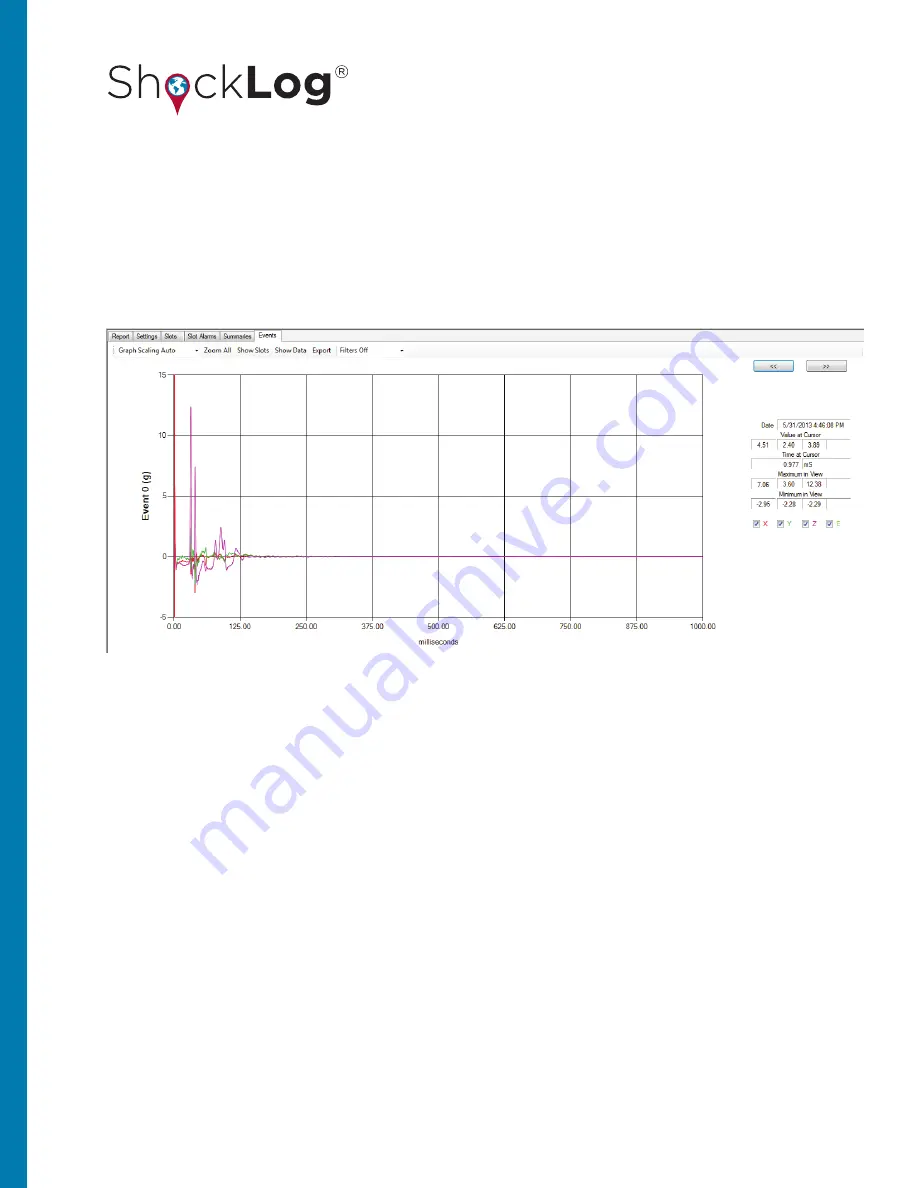
The final tab in the file viewer is the “Events Tab”. This tab displays the detailed event curves for alarm and
warning events. Text data related to a graph is displayed. Above the text there are two arrow buttons that allow
the user to scroll through the events. The event under examination is labeled on the left side of the event. This
section details the different methods of interrogating the Event data to better understand the recorded data.
TEXT DATA
The text information on the right side of the screen is intended to provide additional information about the
event graph being viewed and more specifically the area highlighted or where the cursor is positioned. When
first entering the slot tab, the cursor is at the far-left position of zero and the cursor text information is blank. By
clicking on a different area of the curve, the cursor bar will move, and the text field will be completed with the
localized information. The cursor bar is depicted by a red, vertical line.
The data is split into the different axes, X, Y & Z with an E for any potential external accelerometers that may be
installed. The information is as follows:
Date:
Tells the user the date and time that the current event was recorded. The date and time are in relation to the ShockLog
clock and won’t necessarily match that of the computer.
Value at Cursor:
Shows the value in relation to the event being viewed, the individual axis and where the cursor has been
positioned. In this display, there are four individual boxes, which represent X, Y, Z and E (E=external) and these individual
fields will display the value seen at this point of the event.
Time at Cursor:
Displays the number of milliseconds from the start of the event to the cursor location.


