50
This document is written and published by ShockWatch, Inc. All rights reserved.
USER MANUAL
DETAILED EVENT CURVE
DRAG ‘N’ ZOOM
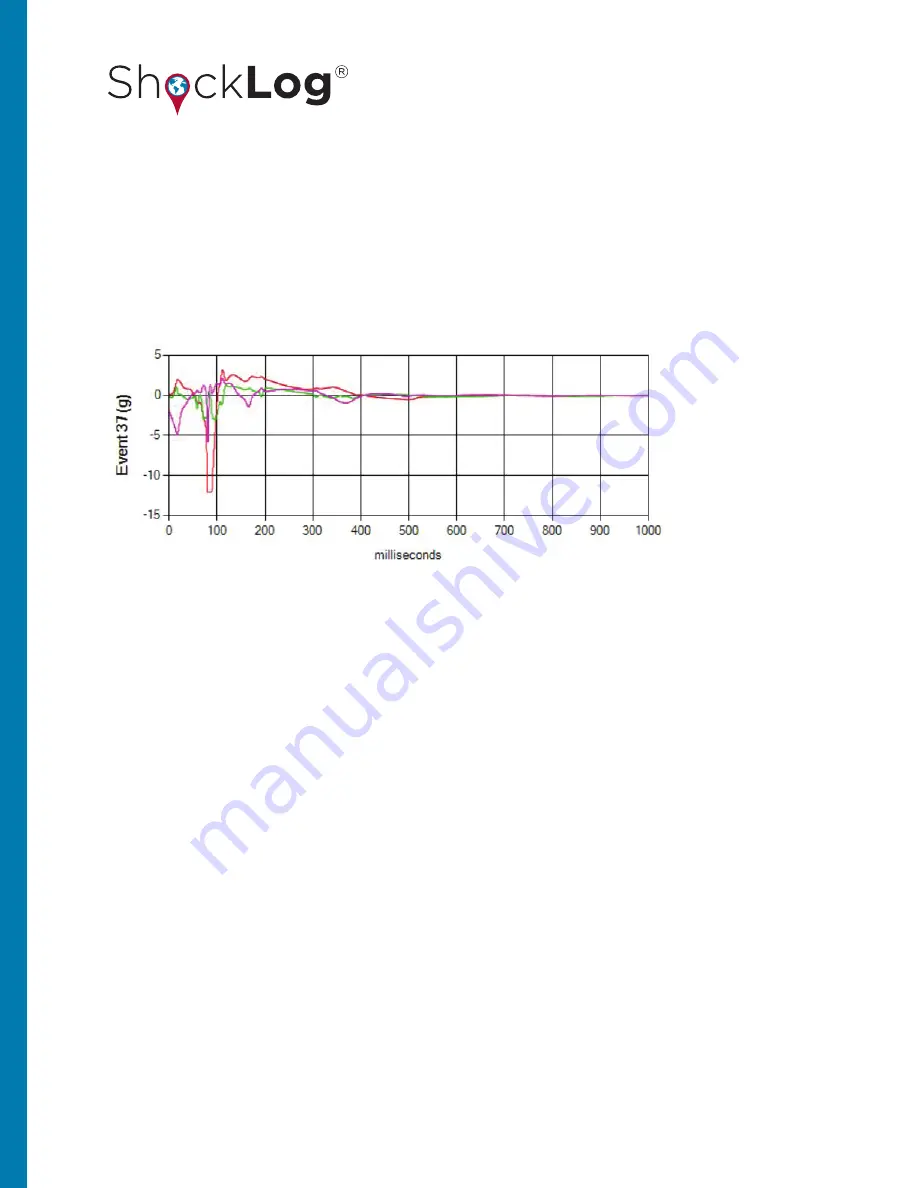
The event curve displays the detailed data curve for a given event. It will display the most severe event when the
report is first opened. Different events are displayed by clicking on them from the Event Summary Graph. The
detailed event curve shows the magnitude and duration of the impact event, with the horizontal axis displaying
the time in milliseconds and the vertical axis showing the force of the impact in g. All three axes will be displayed
giving users a full understanding of the level of impact seen across all axes.
Like the summary event graph, it is possible to zoom in on the most relevant areas of a detailed event graph
allowing users to see the area of most interest.
In order to zoom, place the cursor at the beginning of the area of interest, click and hold the left mouse button
and drag it to the end of the relevant area.
In this example, the area between 0 and 100 milliseconds is of interest. By zooming in, the first 10% of the event
can be displayed with more visual detail. This area is where most of the event activity occurred.
If desired, it is possible to zoom in further. The same method for zooming is used. It is possible to move backwards
and forwards along the event time line utilizing the slide bar at the bottom of the chart. To return to the previous
graph/zoom, click on the button to the left of the slide bar.


