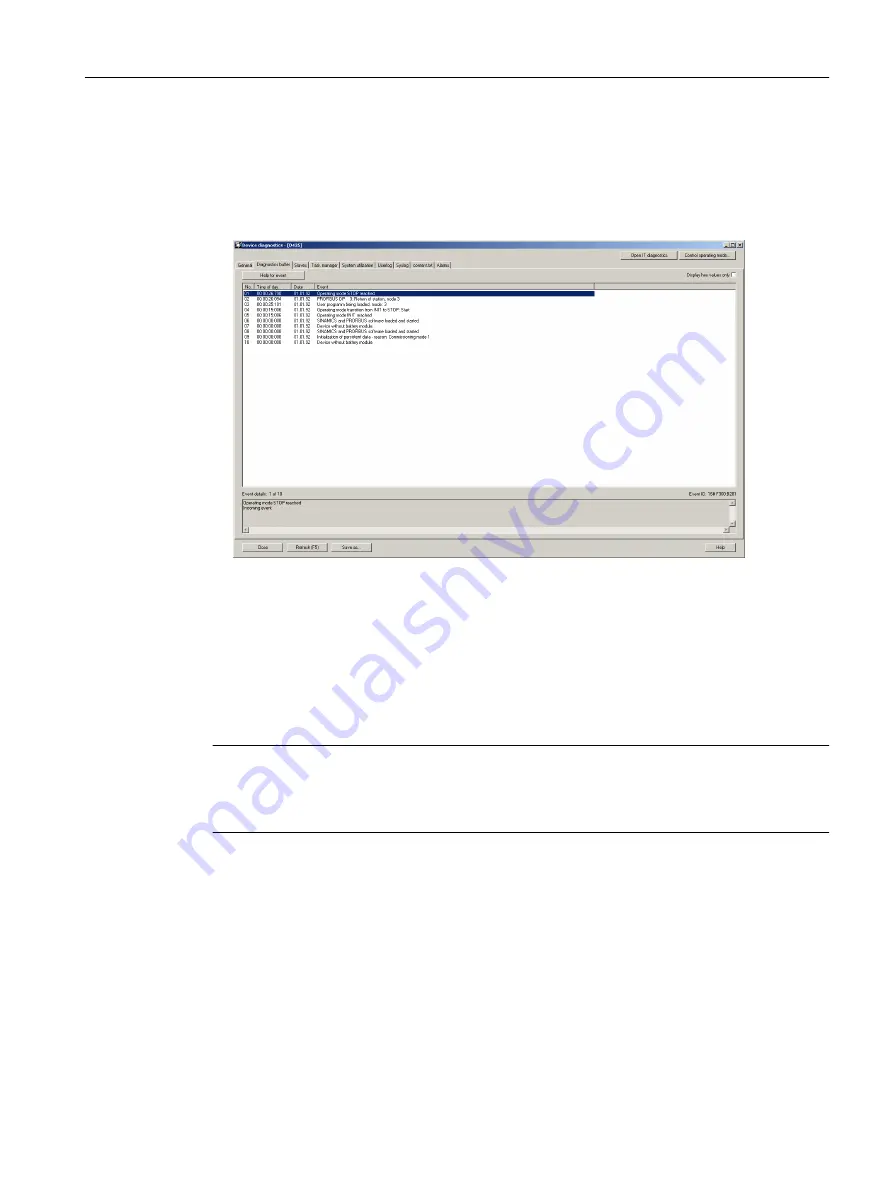
To work with the diagnostics buffer:
1. In the Device Diagnostics window, select the diagnostics buffer tab.
The saved events are displayed in tabular form.
2. Select the event for which you want to obtain more information.
Detailed information for the selected event is displayed in the lower pane of the window.
Figure 9-3
Example of the diagnostics buffer display in the device diagnostics
9.3.4
Device diagnostics: Task Manager
You can display the task runtimes and the status of the tasks set up in the project if you are
connected online with the device. The resolution of the displayed task runtimes is performed
in the servo cycle clock.
Note
The task runtimes are calculated to the µs and indicate the effective level runtime of the
respective task (including the interrupt times). These thus correspond to the values of the
effectiveTaskruntime device variables.
Diagnostics
9.3 Device diagnostics
SIMOTION SCOUT
Configuration Manual, 11/2016
177
Содержание SIMOTION SCOUT
Страница 12: ...Preface 1 4 Hotline and Internet addresses SIMOTION SCOUT 12 Configuration Manual 11 2016 ...
Страница 32: ...Installation 4 4 Licenses SIMOTION SCOUT 32 Configuration Manual 11 2016 ...
Страница 64: ...User interface 5 11 Adding add ons to the workbench SIMOTION SCOUT 64 Configuration Manual 11 2016 ...
Страница 146: ...Configuring parameterizing 6 14 Writing the boot sector SIMOTION SCOUT 146 Configuration Manual 11 2016 ...
Страница 224: ...Product combinations 13 9 DCC programming system SIMOTION SCOUT 224 Configuration Manual 11 2016 ...
Страница 244: ...Index SIMOTION SCOUT 244 Configuration Manual 11 2016 ...


