14
••••
FTTrend
PLC WorkShop for Simatic TI505
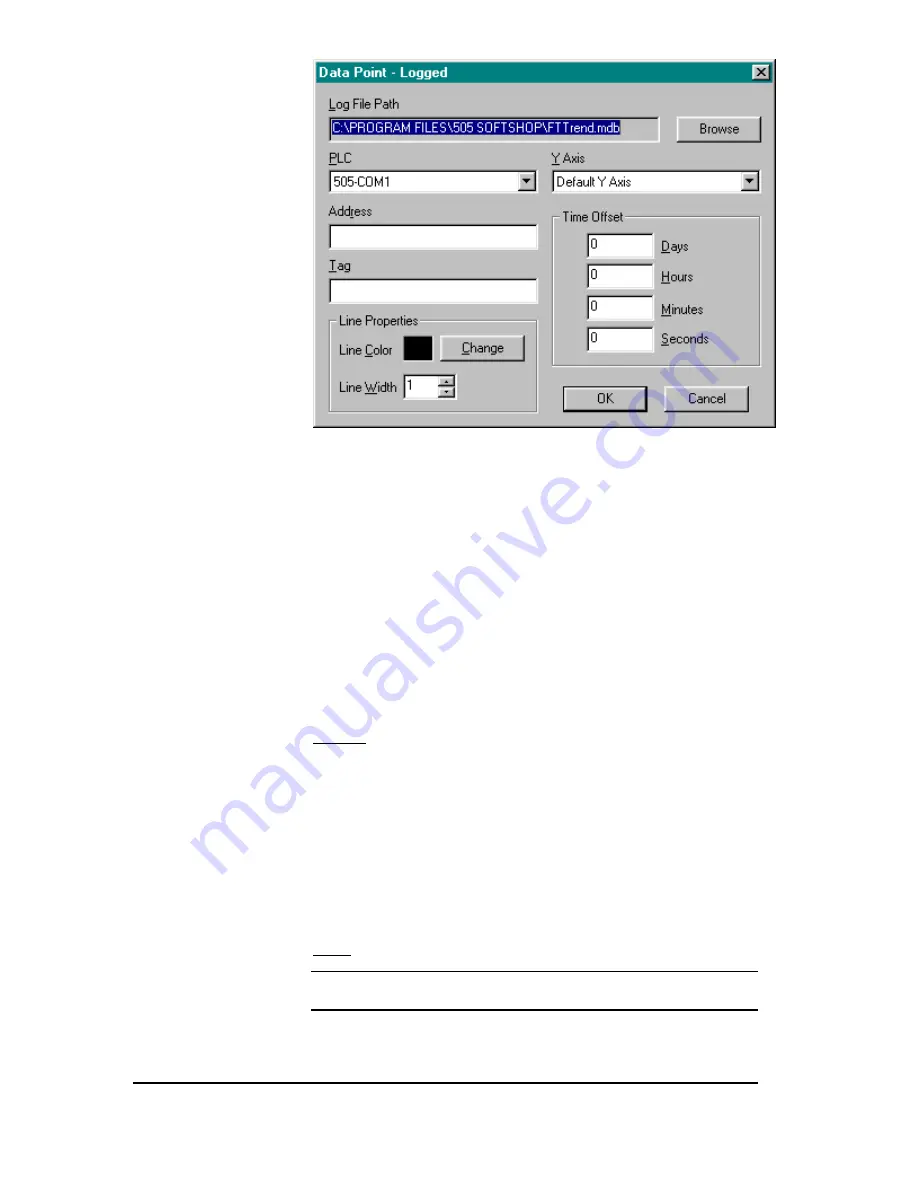
Figure 18
A previously logged database file must be entered under the Log File
Path.
Choose a pre-setup device name from the drop down PLC selection box.
This is the device from which data is to be retrieved from. Then enter an
address (under Address box) or tag (under Tag box) to plot. Entering an
item in the “Tags” list box will display the corresponding address in the
“Address” edit box.
The data point must now be associated with an Y-Axis chart
see Y-Axis
Tab for chart setup.
Select one of the pre-setup names Under the Y-Axis
drop down box. Next enter the sample rate. Sample Rate is how often
data is to be read from the device.
Time Offset allows you to offset the timed data in the database to lineup
with the real time.
Example: If real time data starts logging at 1 p.m. and logged data started
at 11:00 a.m. to synchronize the time enter 2 in the Hours selection box.
Online/Offline
After a device name and y-axis point has been setup the FTTrend can
begin plotting points.
To start real time trending:
Select Online from the Mode menu
Result: Graph will begin plotting.
NOTE
When plotting logged data the graph will automatically start
after the Graph Data dialog box has been configured.
Selecting Offline under the Mode menu stops real time trending.


