PLC WorkShop for Simatic TI505
FTTrend
••••
13
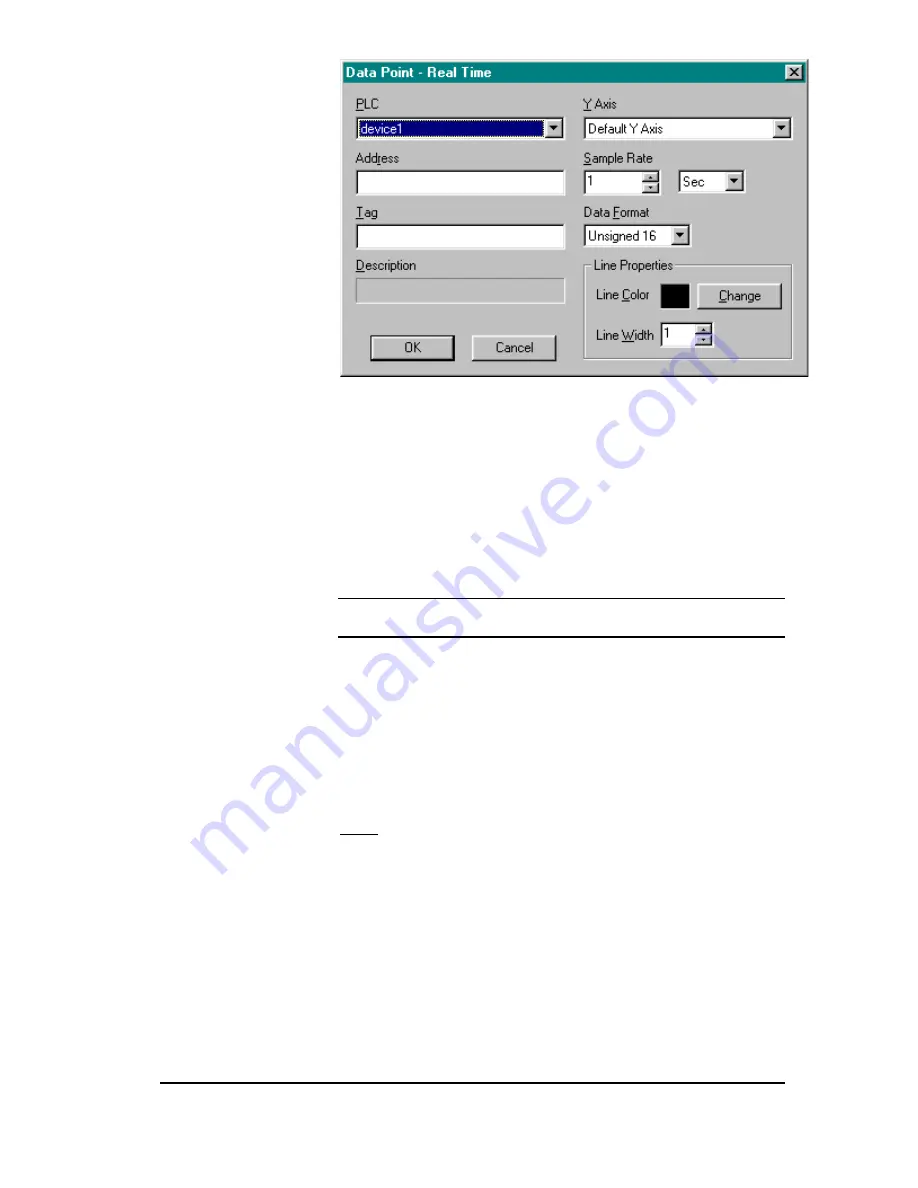
Figure 17
Choose a pre-setup device name from the drop down PLC selection box.
This is the device from which data is to be retrieved from. Then enter an
address (under Address box) or tag (under Tag box) to plot. Entering an
item in the “Tags” list box will display the corresponding address in the
“Address” edit box. If a description is associated with the address or tag
it will be displayed in the Description box.
The data point must now be associated with an Y-Axis chart
see Y-Axis
Tab for chart setup.
Select one of the pre-setup names Under the Y-Axis
drop down box. Next enter the sample rate. Sample Rate is how often
data is to be read from the device.
NOTE Reading large amounts of data may not retrieve data in the desired
sample rate.
The data format (unsigned 16, signed 16, unsigned 32, signed 32 and
floating point) and Line Properties (color and line width/thickness) are
also selected here.
Logged Data point Setup
To add a logged point to plot, select the Add Logged Point button from
the Graph Data dialog box (Figure 16).
Result: Data Point – Logged dialog box appears (Figure 18)


