PVIQ™ CONNECTIVITY SYSTEM USER MANUAL V 1.0
34
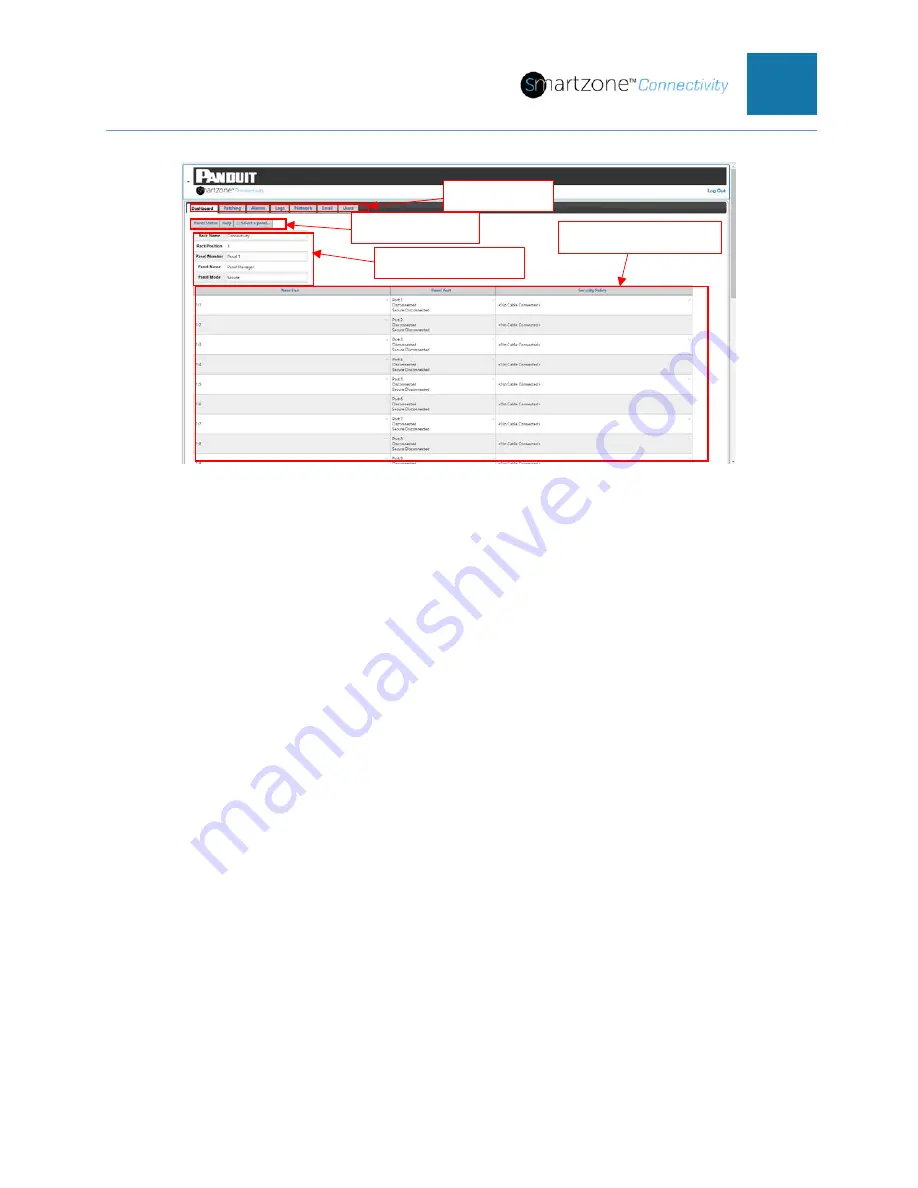
Figure 28: Default Dashboard Page
The dashboard page is a monitor only page. In the ribbon at the upper left side of the
page are seven tabs that you can use to navigate between pages in the PViQ™
Connectivity Web UI.
Page Header
Below the ribbon is the Panel Status heading. Hover over the “Help” to open a tool tip
describing the page. Click the “Select a panel” button to open a drop-down menu where
you can select the viewing of the other panels (EM panels) in the PViQ™ Connectivity
System.
Panel Attributes
Under the page header is a table of attributes for the PViQ™ Connectivity Panel and the
rack/cabinet where it is located. The default values are shown in the figure above. You
can change these attributes (on the Network page). Hover over each panel attribute to
view a description of that attribute.
Panel Port Status
Under the panel attributes table is the main table on the page. This table provides the
real time status of the individual ports on the panel. There are three fields across the top
of the table. Each field is explained in the following sections.
Near End
The “Near End” column is defaulted to the
panel number:port number
. The first row
indicates panel 1: port 1, the second row is panel 1: port 2, etc., as shown in the
Page Tabs
Page Header
Panel Attributes
Panel Port Status