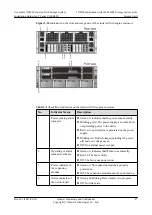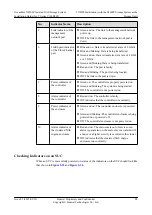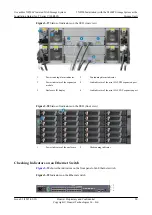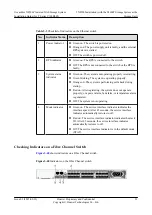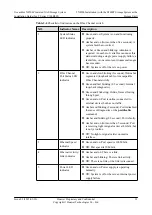
No.
Indicator Name
Description
5
Link indicator of the
management
network port
l
Green and on: The link to the management network
port is up.
l
Off: The link to the management network port is
down.
6
Link/Speed indicator
of the Fibre Channel
port
l
Blue and on: Data is transferred at a rate of 8 Gbit/s.
l
Blue and blinking: Data is being transferred.
l
Green and on: Data is transferred at a rate of 4 Gbit/
s or 2 Gbit/s.
l
Green and blinking: Data is being transferred.
l
Red and on: The port is faulty.
l
Red and blinking: The port is being located.
l
Off: The link to the port is down.
7
Power indicator of
the controller
l
Green on: The controller is properly powered on.
l
Green and blinking: The system is being started.
l
Off: The controller is not powered on.
8
Alarm indicator of
the controller
l
Red and on: The controller is faulty.
l
Off: indicates that the controller runs normally.
9
Power indicator of
the enclosure
l
Green and on: The controller enclosure is powered
on.
l
Green and blinking: The controller enclosure is being
powered on or powered off.
l
Off: The controller enclosure is not powered on.
10
Alarm indicator of
the clustered NAS
engine enclosure
l
Red and on: The enclosure is out of service or an
alarm is generated on the enclosure or an alarm with
a major or a higher severity is occurred in the cluster.
l
Off: indicates that the clustered NAS engine
enclosure runs normally.
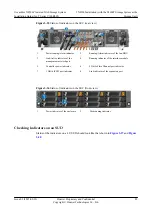
Checking Indicators on an SUC
When an SUC is successfully powered on, status of the indicators on the SUC should look like
that shown in
OceanStor N8500 Clustered NAS Storage System
Installation Guide (for T Series V100R005)
5 N8500 Installation (with the S2600T Storage System as the
Storage Unit)
Issue 02 (2015-09-22)
Huawei Proprietary and Confidential
Copyright © Huawei Technologies Co., Ltd.
88

