68
Boiler Menus
continued
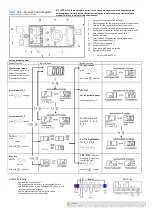
Datalog 1...5 range of representation
1. Press the button
Range of representation
in the menu
Edit datalogs 1...5
.
2. Select the green input fields to select the
minimum and maximum values of the range
of representation for the relevant measuring
signal.
3. The current value appears in the input mask.
The on-screen keyboard can be used to
modify this.
2. Press the button
to save the current
diagram.
Press Save in the information window that
opens. Saved datalogs can be read out via an
FTP from the CompactFlash™ card and can
be evaluated using a spreadsheet program
for example.
3. Press the button
to delete the current
diagram.
Press Delete in the information window that opens.
Note
The min/max value that appears is produced from the original range limit for the meas-
ured value to be represented. When the limits are changed, the original values are not
changed retrospectively.
By changing the minimum and maximum values, the representation of the measured
value in the datalog (trend) can be stretched or compressed.
Содержание SPECTORcontrol
Страница 82: ...82 For your notes ...
Страница 83: ...83 For your notes ...


