


35
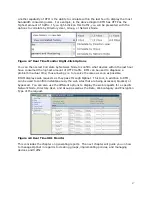
System Reports tab
System Reports tab reports on the actual system health of Optinet. This report posts the
CPU and RAM utilization of the device. The report will also post the active connections in
the network as well as requests for Directory Users. Understanding this report will allow
you to schedule maintenance, plan for upgrades, and prevent problems on the network or
with Optinet.
•
Active Users—this report refers to active devices present on the network.
•
CPU Utilization—this report refers to how much of the Central Processing Unit (CPU)
Optinet is utilizing.
•
Directory Agent Requests—this report lists how many requests Optinet has sent to
the Directory Agent installed on your directory server. For this report to post
information, Directory Users must be integrated with Optinet. Please see Chapter 7:
Integrating Directory Users with Optinet for more information.
•
IP Connections—this report refers to live IP flows traversing through Optinet.
•
Latency—this report shows in milliseconds the response time for PING requests sent
from Optinet to the network’s default gateway.
•
HTTP Connections—this report shows the number of connections per second to Web
sites being filtered by Optinet.
•
HTTP Requests—this report shows the number of Web requests per second Optinet
has filtered.
•
Packets per Second—this report displays the number of Internet packets per second
passing through Optinet.
•
RAM Usage—this report shows the amount of Random Access Memory (RAM) Optinet
is using.
•
SSL Connections—this report shows the number of HTTP Connections that have been
established with SSL. For this report to function, Optinet must be configured for
HTTPS/SSL Filtering. For more information on this feature, please see Chapter 8:
Implementing HTTPS/SSL Filtering with Optinet.
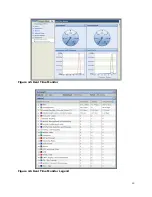
Dashboards tab
The Dashboards tab presents two tools that demonstrate traffic and Web request in real
time. These tools are Real Time Monitor (RTM) and Real Time URL Monitor (RTUM).
RTM displays traffic amounts as they happen. This can be helpful in troubleshooting
network problems or resolving bandwidth issues in real time. RTM will post total application
traffic, both upload and download, with a legend representing distinct applications. RTM
parses traffic in three second intervals and display the amounts accordingly.


