


30
resources for other operations. If a report cannot complete within the five minutes, you will
receive a timeout message.
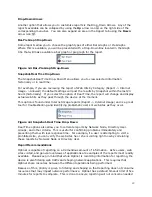
If you receive a timeout message, you may alter the time limit under the Advanced Setup
menu (Admin -> Configuration -> Advanced Setup -> Database Timeout). You can allocate
up to 15 minutes for reports to complete. Don’t forget to Apply the changes. This will allow
the database to dedicate more time to complete the report and post the results.
Nonetheless, detailed reports that span large amounts of time and cover multiple users or
applications may better be executed during non-peak traffic times; thus allowing more
resources for Optinet to complete the report without running the risk of affecting network
traffic or filtering and shaping rules.
In addition to running detailed reports during non-peak traffic times, you can also use
Summary Tables to expedite reporting results. Summary Tables allow Optinet to
summarize or condense large web reports, allowing for a faster response time with Internet
Usage reports. This utility will index web reports and correlations for all reports once the
option is selected. Summary Tables also decrease dependency on shared resources.
To enable Summary Tables go to Admin -> Configuration -> Advanced Setup and select the
checkbox next to Enable Summary Tables. This will begin indexing web requests to allow
for faster Internet Usage reporting. Please note that the Enable Summary Tables option will
only begin summarizing from that point forward. If you would like to summarize previous
data gathered before Enabling Summary Tables, you will need to run the Conversion Utility.
The Conversion Utility will take previous data that has not been summarized and create a
summary table for that information. There are three options for converting previous data:
Web Request Summary Table, Level 1 Summary, and Level 2 Summary. Web Request
Summary Table will summarize all Web requests data. Level 1 Summary Table will
summarize the first correlation for those reports, i.e., first correlation by Category, Host,
File Type, MIME Type, Group, Directory User, and Network Node. Level 2 Summary Table
will summarize the second correlation for those reports, i.e., second correlation by
Category, Host, File Type, MIME Type, Group, Directory User, and Network Node.
The Conversion Utility is located under Admin -> Configuration -> Advanced Setup -> Run
Conversion Utility Now. Once selected, you will be presented with the three different levels
of conversion: Web Request Summary Table, Level 1 Summary Table, and Level 2
Summary Table. You can then select the Start Conversion Now button next to each level to
activate the conversion.
The Conversion Utility places additional load on Optinet and may consume a large amount of
processes. Because of this, we strongly recommend that you run the Conversion Utility
during non-peak hours to avoid unnecessary interruptions in network traffic. Also note that
you can only run one conversion at a time, and they must be done in order.
This concludes the section on general reporting options. In the next sections we will discuss
the different reports for application and web traffic.
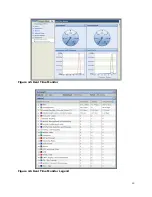
Users tab
The Users tab gives you an overview of the Internet traffic generated on your network by
users. This report will display the top 25 users, devices, or groups on your network within


