31
1.
Diagnostics Toolbar Buttons
– see
Table 4-2 Diagnostics Toolbar Buttons
on
page 24 for detailed descriptions of the operations for each button.
2.
Main Section
– the left column displays the item names; the right column shows
the specifications or descriptions.
3.
Functional Button
– in this case, only a
Back
(or sometimes an ESC) button is
available; tap it to exit after viewing.
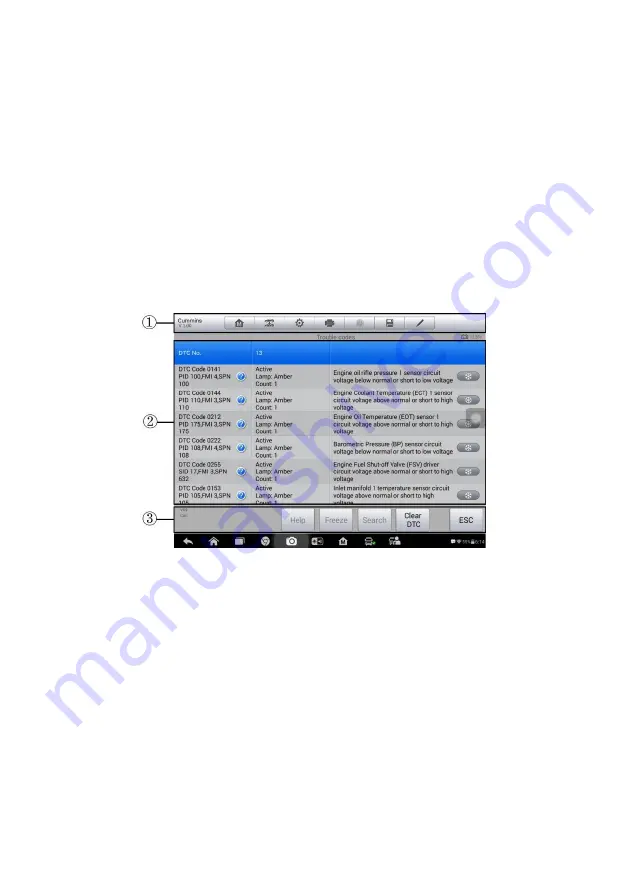
Trouble Codes
This function retrieves, displays and erase
the DTCs from the vehicle’s control system.
The Trouble Codes screen varies for each vehicle being tested. When the Freeze
Frame data of certain DTCs are available for viewing, a snowflake button will display on
the right side of the DTC item. For some vehicles, the Trouble Codes function will
display as three functions separately, Read DTC, Clear DTC, and Freeze Frame.
1.
Diagnostics Toolbar Buttons
– see
Table 4-2 Diagnostics Toolbar Buttons
on
page 24 for detailed descriptions of the operations for each button.
2.
Main Section
Code Column
– displays the retrieved codes from the vehicle.
Status Column
– indicates the status of the retrieved codes.
Description Column
– detailed descriptions for the retrieved codes.
Snowflake Icon
– only displays when freeze frame data is available for viewing;
Selecting this icon will display a data screen, which looks very similar to the
Read Codes interface, therefore same operation method may be applied.
3.
Functional Button
Help
– displays the detailed codes-related information.
Figure 4-12
Sample Trouble Codes Screen
Содержание MAXISYS
Страница 83: ...76 Figure 8 9 Sample About Screen ...


