User Guide
APconnections, Inc. // 303.997.1300 // www.netequalizer.com
Page 48 of 96
All rights reserved
Copyright © 2014, 2015 APconnections, Inc.
rev. 20150309
Dynamic Real-Time Reporting (RTR)
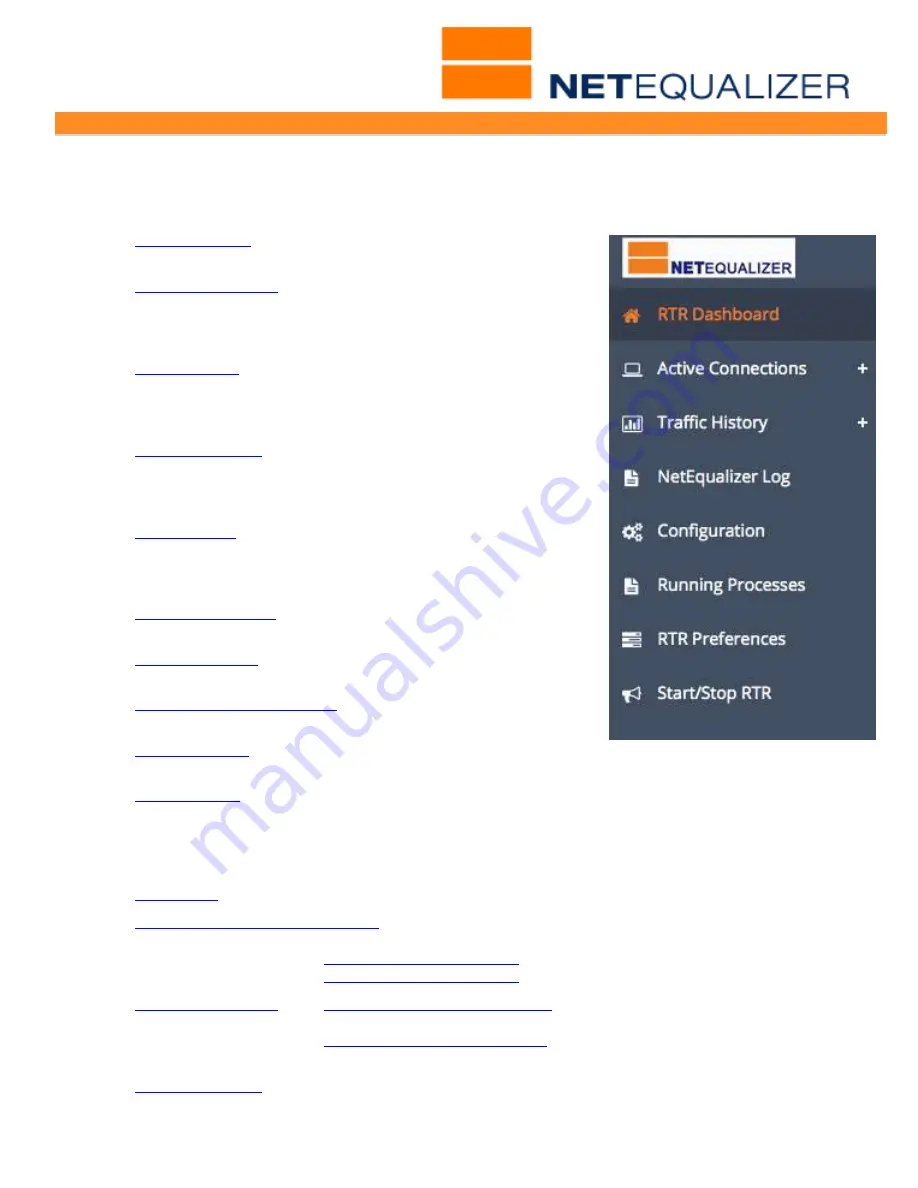
The RTR Menus are shown at right. This menu is displayed when you click on Dynamic RTR
or View Historical Reports. The following reports and functions are available via RTR:
1.
RTR Dashboard
- View traffic in real-time flowing
through NetEqualizer.
2.
Active Connections
- Sortable and searchable real-time
view of all connections active on the
NetEqualizer. Links to IP Reports
and Traffic by IP Graph.
3.
Traffic History
- Graphs that show up to 4 weeks
worth of upload and download
bandwidth usage for your entire
network, Pool, VLAN, or tracked IP.
4.
NetEqualizer Log
- Displays key activity on the
NetEqualizer, such as limits being
applied, and penalties being added
or removed.
5.
Configuration
- View how you have defined the key
parameters, traffic limits, priorities,
and P2P limits on your NetEqualizer.
Use this to validate your settings.
6.
Running Processes
- Check out what processes are
running on your NetEqualizer.
7.
RTR Preferences
- Select units in which to view your
graphical data.
8.
Reporting Data Warehouse
- Create a periodic dump of
reporting data from RTR
9.
Start/Stop RTR
- Turn RTR on/off and view RTR
statistics.
10.
Autostart RTR
- Turn RTR on automatically upon a NetEqualizer reboot.
View Current Activity
This menu is displayed when you click on View Current Activity.
1.
P2P Report
- View suspected peer-to-peer (P2P) traffic for any IP or subnet.
2.
Instantaneous Bandwidth Usage
-View bandwidth usage at this moment for a specified IP.
Show IPv4 Instant Report
Show IPv6 Instant Report
3.
Active Connections
-
View IPv4 Active Connections
Same as RTR Active Connections above
View IPv6 Active Connections
View IPv6 current live data
streams for traffic on your network.
4.
NetEqualizer Log
- Same as RTR NetEqualizer Log above.


