Appendix C – APDiagnostics
126
Epica DGX 32 Instruction Manual
Information Pane Plot Views
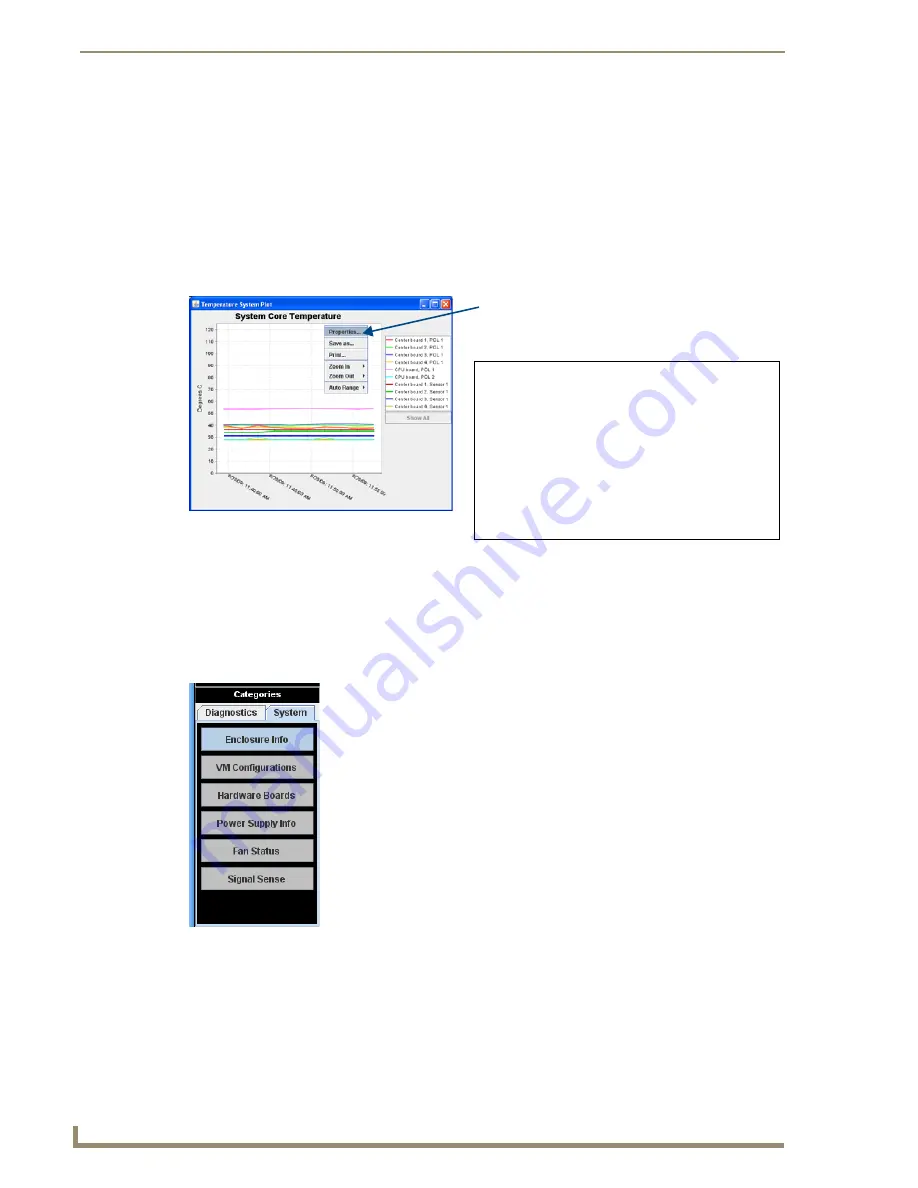
A Plot Views window displays a graph of data points for the components for which it is associated.
The graph has a legend at the right and is time-stamped in intervals across the bottom. The amount of
historical data points presented in the graph can be determined by changing the settings in the
Application Preferences dialog box (see page 129).
Legend items in a Plot View are selectable; doing so will filter the view so that only the selected items
are displayed. Furthermore, if only a single item is selected, its Warning and Error setpoint values will
also display in the window for reference.
Tip: For a hard copy of a graph, save as a .png file, then print the .png.
For information on changing the viewing of the graph, see the APDiagnostics Help file.
To display System information:
1.
In the Categories pane, select the System tab.
2.
Click the desired System button to display its corresponding details in the Information pane:
To access graph options:
1.
Right click on the graph and select a shortcut
menu item.
Properties – opens a Chart Properties dialog box with
three tabs: Title, Plot, and Other.
Save as – opens a standard Save dialog box.
Print – opens a standard Page Setup dialog box.
Zoom In – provides options to zoom in on Both Axes,
Domain Axis, or Range Axis.
Zoom Out – provides options to zoom out on Both Axes,
Domain Axis, or Range Axis.
Auto Range – provides options for auto display of Both
Axes, Domain Axis, or Range Axis.
Enclosure Info
– XNNet ID, Firmware Version, Host IOS Version, and
FW (Firmware) Build Date.
VM Configurations
– A table with the VM Name, VM Number, Inputs,
and Outputs.
Hardware Boards
– A table with board numbers for Inputs, Outputs, and
Center boards.
Power Supply Info
– Model number, Serial number, Revision, and Service
Hours for each power supply. (If a power supply is listed as “not reporting,”
either it is not physically present or it is not being reported by the
enclosure.)
Fan Status
– a table indicates Fan #, Speed (RPS), and Health with an icon
for wellbeing (green check mark, yellow !, or red !).
Signal Sense
– A table indicates whether a signal is present on each of the
input and output channel connections on the switcher. The signal may or
may not be routed, but the source device must be connected and powered on
for the table to indicate that the signal is present.
Note:
The Signal Sense table does not show crosspoint status.
information pane plot views
Содержание Epica DGX 32
Страница 1: ...Instruction Manual AutoPatch Matrix Switchers Epica DGX 32 Distribution Matrix Release 3 19 2010 ...
Страница 6: ...Contents iv Epica DGX 32 Instruction Manual ...
Страница 12: ...Notices 6 Epica DGX 32 Instruction Manual ...
Страница 50: ...Installation and Setup 44 Epica DGX 32 Instruction Manual ...
Страница 56: ...Epica DGX 32 SC Optical Boards 50 Epica DGX 32 Instruction Manual ...
Страница 60: ...Epica DGX 32 DVI Boards 54 Epica DGX 32 Instruction Manual ...
Страница 98: ...NXB AP 1000 Interface Initial Setup by Network Admin 92 Epica DGX 32 Instruction Manual ...
Страница 102: ...NXB AP 1000 Interface Controlling the Epica DGX 32 96 Epica DGX 32 Instruction Manual ...
Страница 108: ...NXB AP 1000 Interface Additional Info for Network Admin 102 Epica DGX 32 Instruction Manual ...
Страница 114: ...Appendix A EDID Programmer 108 Epica DGX 32 Instruction Manual ...
Страница 126: ...Appendix B Managing Configuration Files 120 Epica DGX 32 Instruction Manual ...


