ABEM Terrameter SAS 1000 / SAS 4000
- 68 -
8.2.4
Data Quality Checking and Editing
ERIGRAPH can be used for a visual data quality assessment, and it is recommended to plot
data for each n-factor or each electrode spacing separately, or it may appear as the example in
Figure 20. Furthermore, since many data points may be overlapping in the plots, the function
to plot either the first or the last data point saved in the data file should be used.
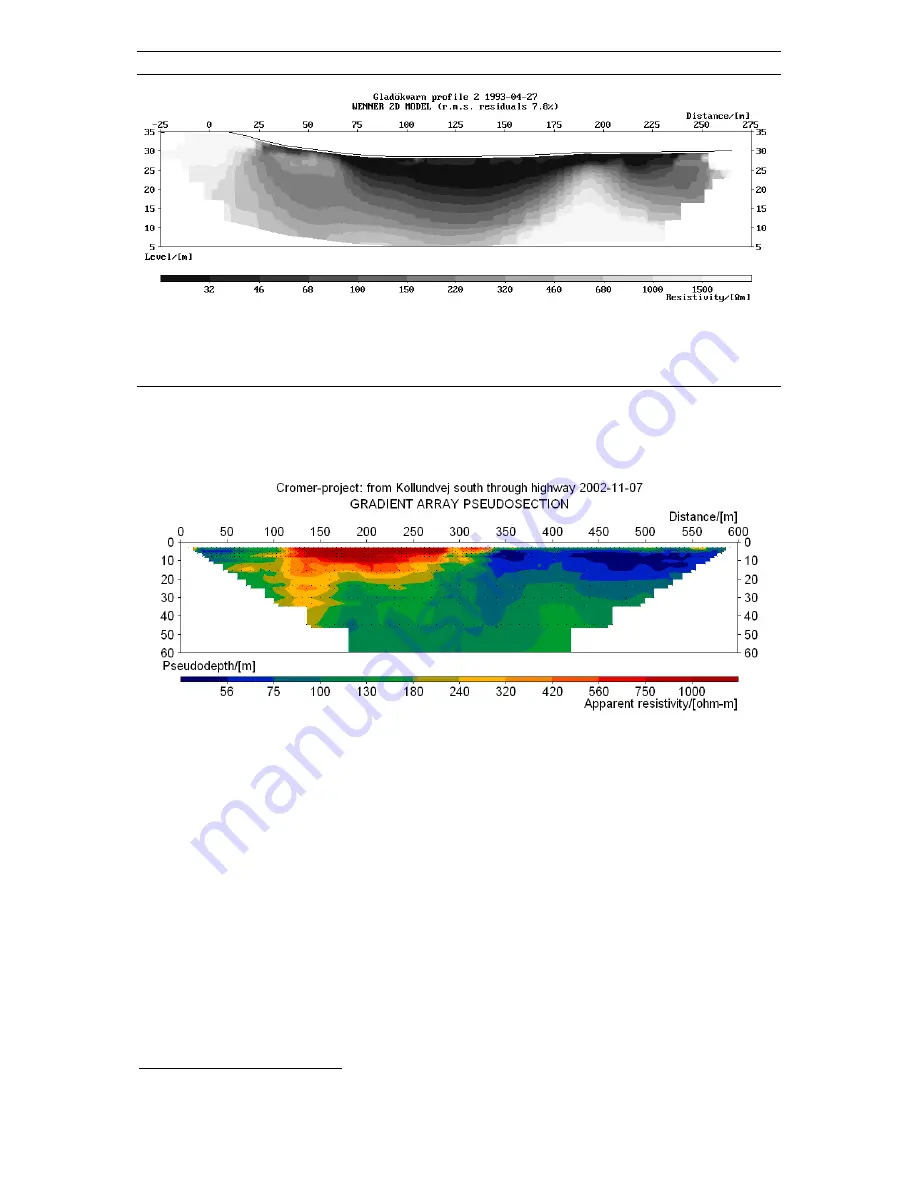
Figure 20.
Example of pseudosection plot of multiple gradient array data with mixed
n-factors and electrode separations.
It is possible to use the “Exterminate bad datum points” feature in RES2DINV
13
for editing
away noisy data points. It is, however, often more difficult to identify which are the noisy data
points for arrays with a mix of different a-separations and n-factors than for e.g. Wenner data.
It is common that the plots have an apparently noisy character even for very good data
quality. However, from version 3.55 RES2DINV has a facility to plot multiple gradient array
data in a way that facilitates editing, provided sub-array type 15 is specified on line 3 in the
DAT-file, see example in Figure 21.
13
Res2dinv version 3.51 or later of is assumed.
Figure 19.
Example of an inverted 2D section.


