ABEM Terrameter SAS 1000 / SAS 4000
- 65 -
If the topography is not included in the DAT file by the conversion routine it can be manually
copied into the data file in the regular format after the resistivity data, but a line with the text
“Topography in separate list” must be added between the resistivity data and the topography
data (i.e. immediately before the topography data section) when using the general four
electrode format.
8.2.2
Pseudosection Plotting
A common method for qualitative presentation of CVES/2D resistivity data is the drawing of
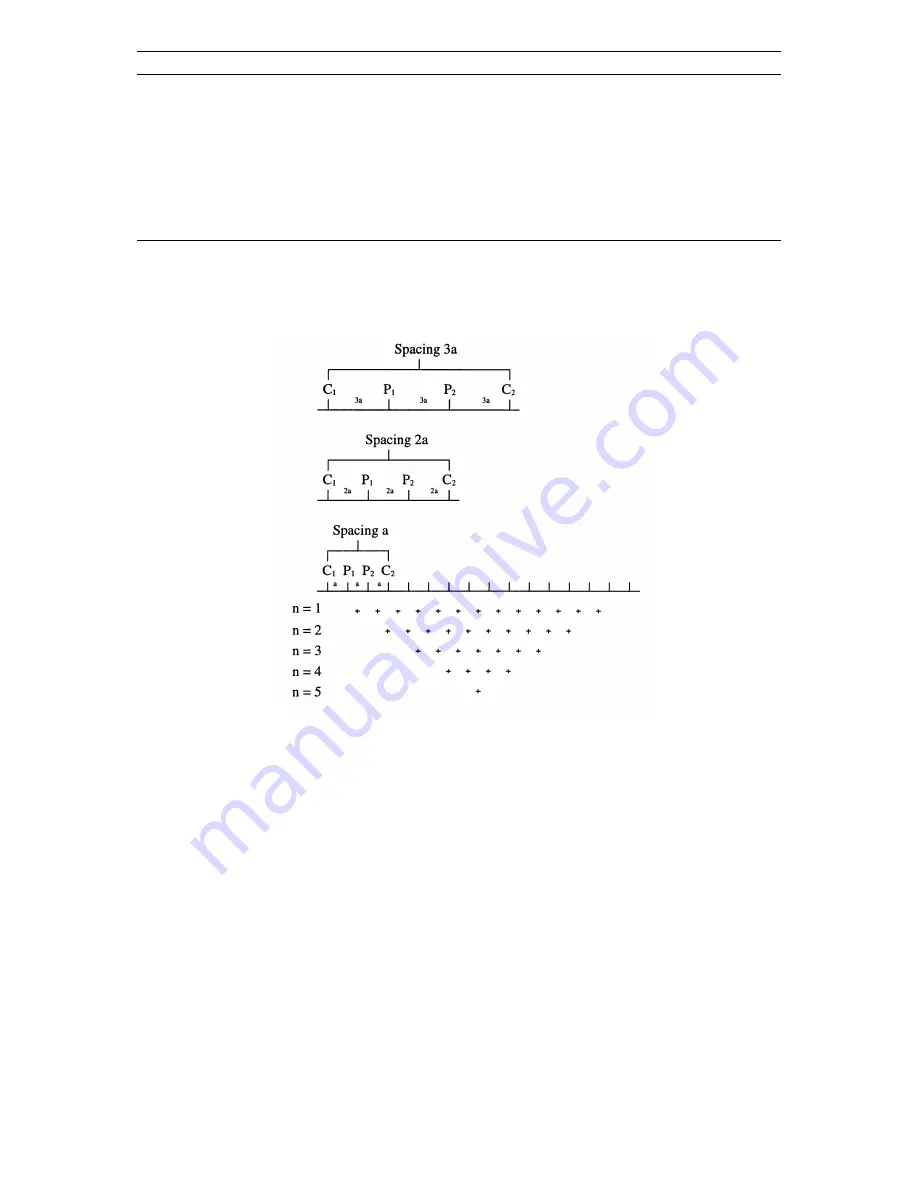
pseudosections. A pseudosection is made by plotting the data points in a diagram, using the
length axis for the distance along the surveying line and the depth axis for the electrode
separations, as indicated in Figure 17.
The distance for the electrode configuration midpoint is thus plotted against the electrode
separation for each measured data point, letting the latter reflect the measurement depth. The
corresponding apparent resistivity for the plotted points are then used to contour the variation
in apparent resistivity along the surveying line. The pseudosection thus obtained reflects the
variation of resistivity in the ground in a qualitative way, and an experienced interpreter may
estimate approximate structures and depths to layer interfaces. It should be noted that a
pseudosection is simply a 2D equivalent of the plotted field data points in a VES diagram,
however normally with a linear depth scale instead of a logarithmic scale as is normally used
in VES.
In this context, the drawing of pseudosections needs computer assistance to be practical due to
the large amounts of data. The ERIGRAPH software is developed for automatic drawing of
pseudosections in grey scales or colour, using linear interpolation between data points. Linear
interpolation involves no smoothing of data, which gives a good indication on the data
quality.
Figure 17. Principle for building up a pseudosection


